| Start Page |
|
 |
| Start Page |
|
|
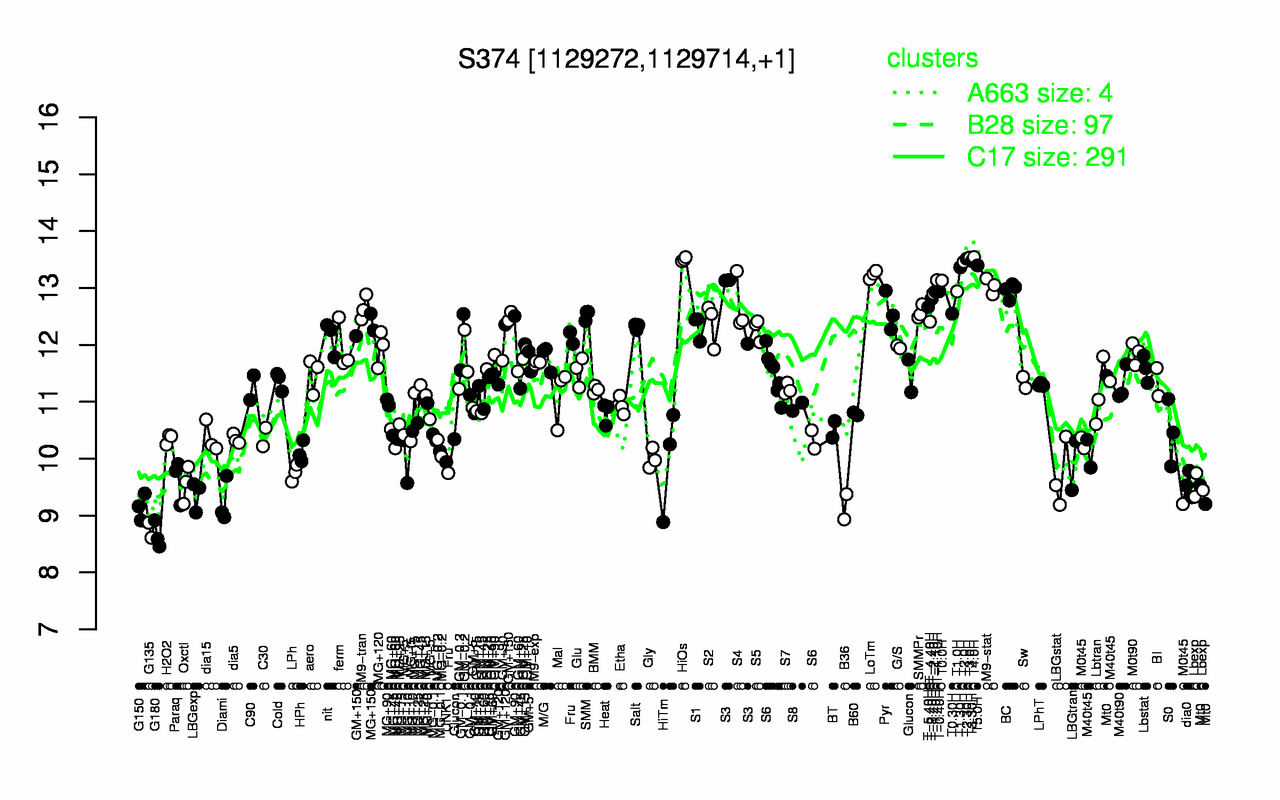
| T4.0H | T3.0H | T2.30H | HiOs | T3.30H | T2.0H | T5.0H | T1.30H | LoTm | T-1.10H |
| 13.5 | 13.5 | 13.5 | 13.5 | 13.5 | 13.5 | 13.4 | 13.4 | 13.2 | 13.1 |
| G180 | G135 | B36 | G150 | Diami | LBGexp | Lbexp | dia0 | Oxctl | Paraq |
| 8.65 | 8.74 | 9.15 | 9.15 | 9.24 | 9.36 | 9.51 | 9.55 | 9.55 | 9.62 |