| Start Page |
|
 |
| Start Page |
|
|
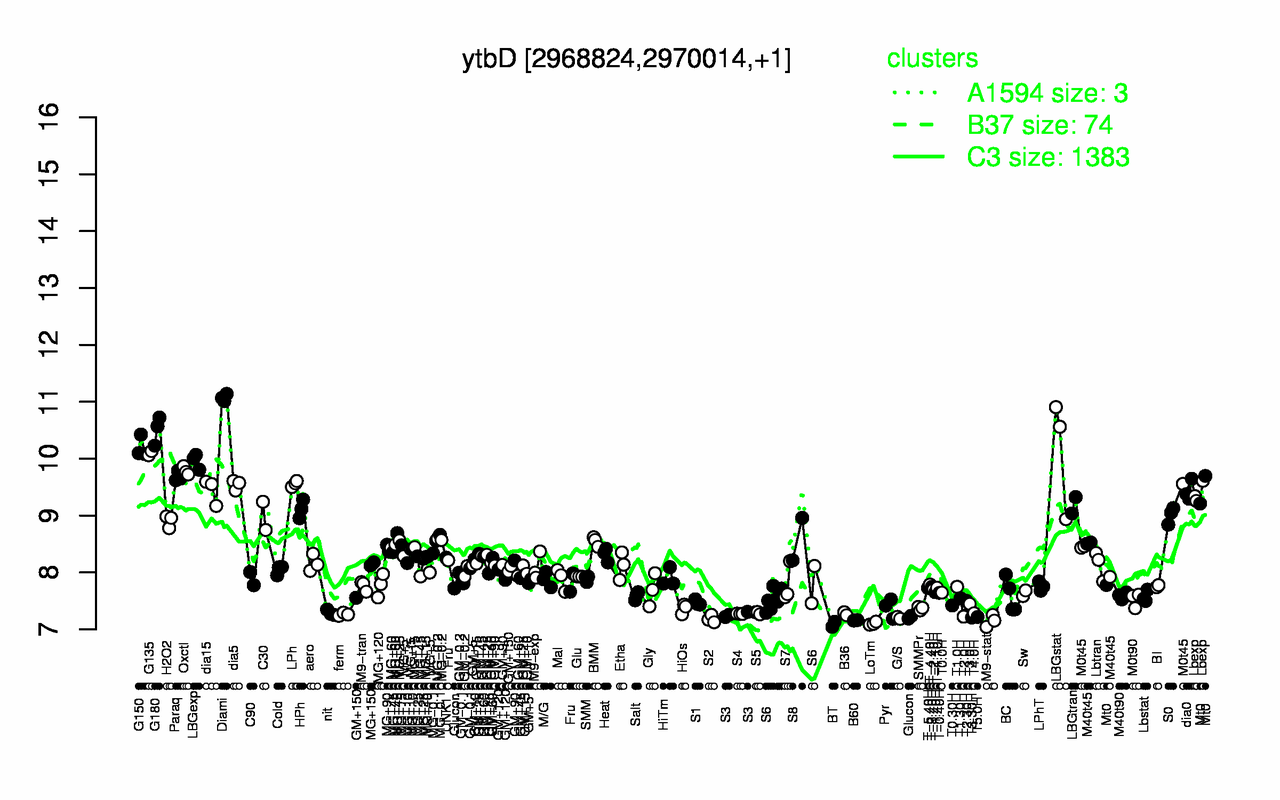
| Diami | G180 | G150 | LBGstat | G135 | LBGexp | Oxctl | Paraq | LPh | dia5 |
| 11.1 | 10.5 | 10.2 | 10.1 | 10.1 | 9.96 | 9.79 | 9.69 | 9.56 | 9.54 |
| BT | LoTm | M9-stat | B60 | S2 | G/S | T3.30H | T5.0H | T2.0H | S3 |
| 7.09 | 7.1 | 7.15 | 7.16 | 7.18 | 7.2 | 7.21 | 7.22 | 7.22 | 7.26 |