| Start Page |
|
 |
| Start Page |
|
|
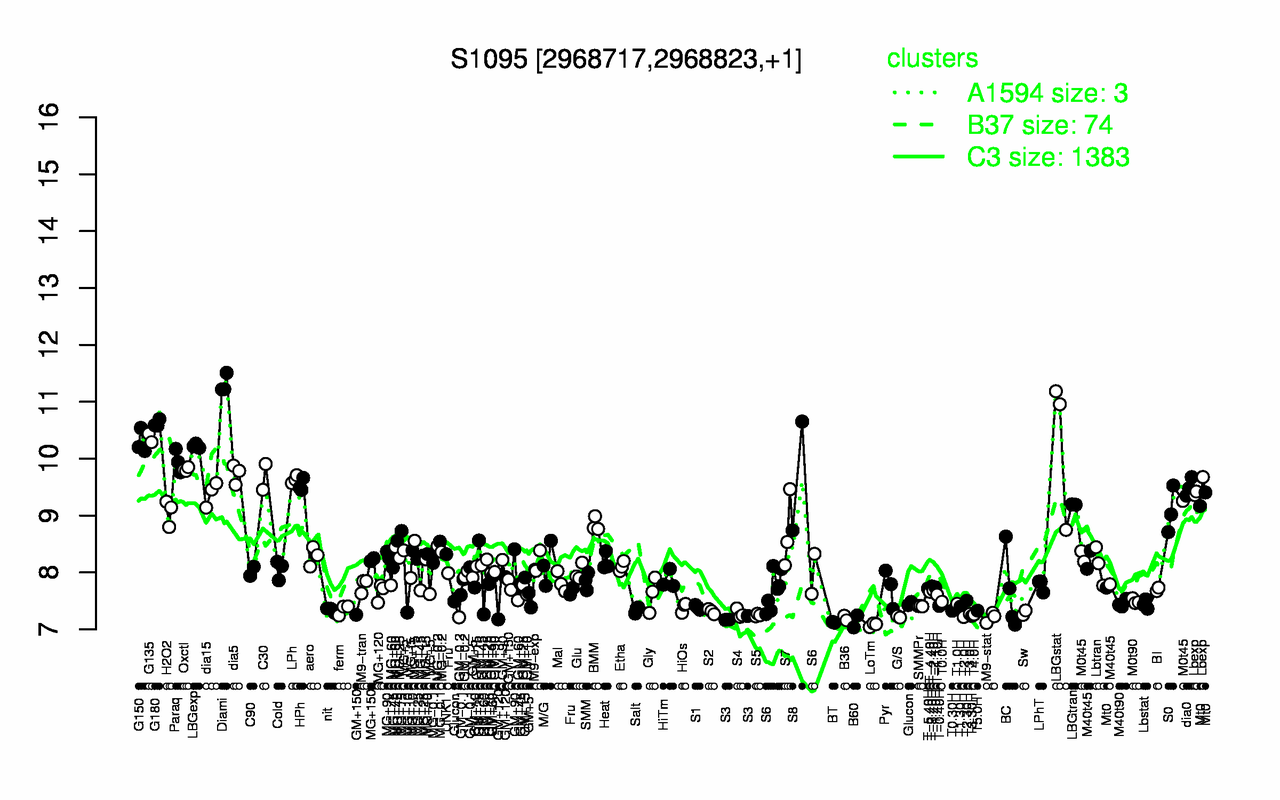
| Diami | G180 | G135 | LBGstat | G150 | LBGexp | Paraq | Oxctl | dia5 | S8 |
| 11.3 | 10.6 | 10.4 | 10.3 | 10.3 | 10.2 | 9.96 | 9.81 | 9.73 | 9.7 |
| LoTm | BT | B60 | S3 | B36 | M9-stat | T2.0H | G/S | T3.30H | S5 |
| 7.08 | 7.12 | 7.14 | 7.19 | 7.2 | 7.21 | 7.22 | 7.22 | 7.24 | 7.25 |