| Start Page |
|
 |
| Start Page |
|
|
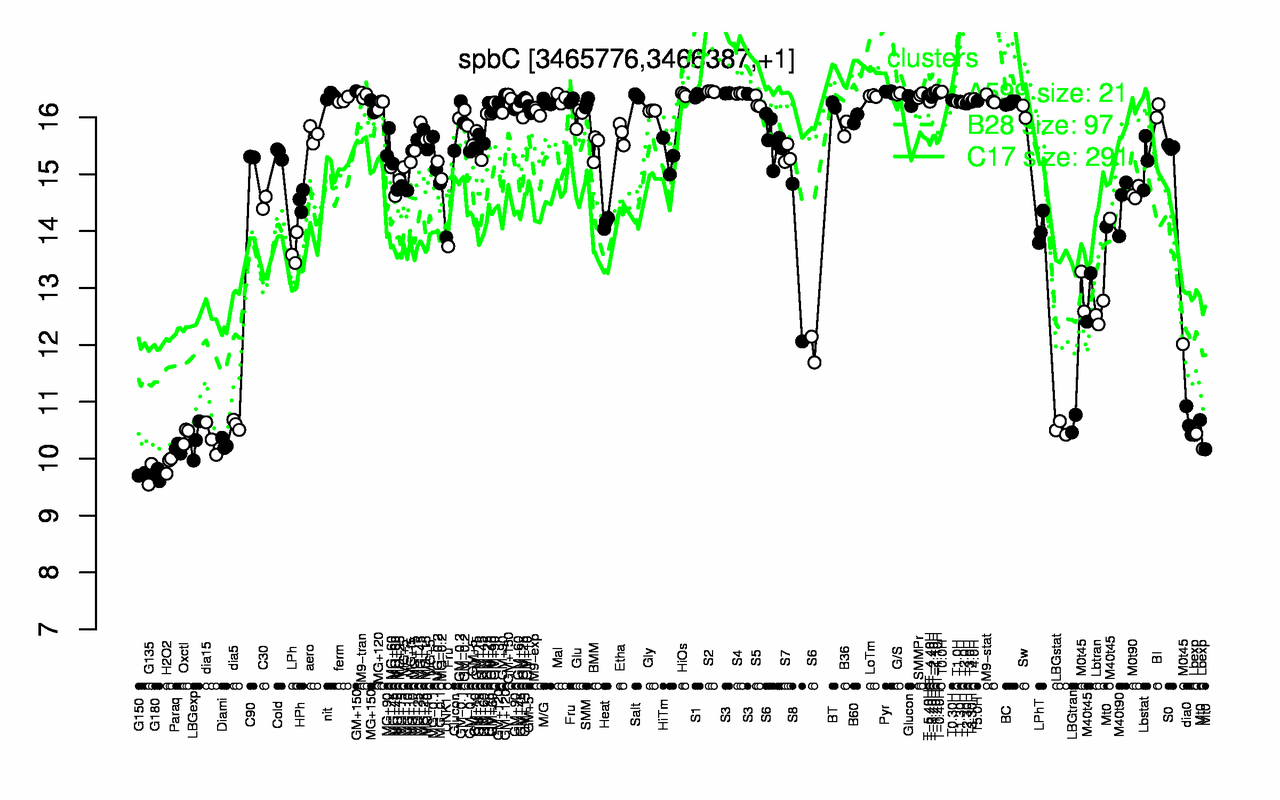
| T-1.10H | S2 | T0.0H | Pyr | T-0.40H | T-1.40H | T-2.40H | S4 | S3 | G/S |
| 16.5 | 16.5 | 16.5 | 16.4 | 16.4 | 16.4 | 16.4 | 16.4 | 16.4 | 16.4 |
| G150 | G180 | G135 | H2O2 | Paraq | Diami | LBGexp | Lbexp | dia15 | Oxctl |
| 9.72 | 9.72 | 9.73 | 9.9 | 10.2 | 10.3 | 10.3 | 10.3 | 10.3 | 10.4 |