| Start Page |
|
 |
| Start Page |
|
|
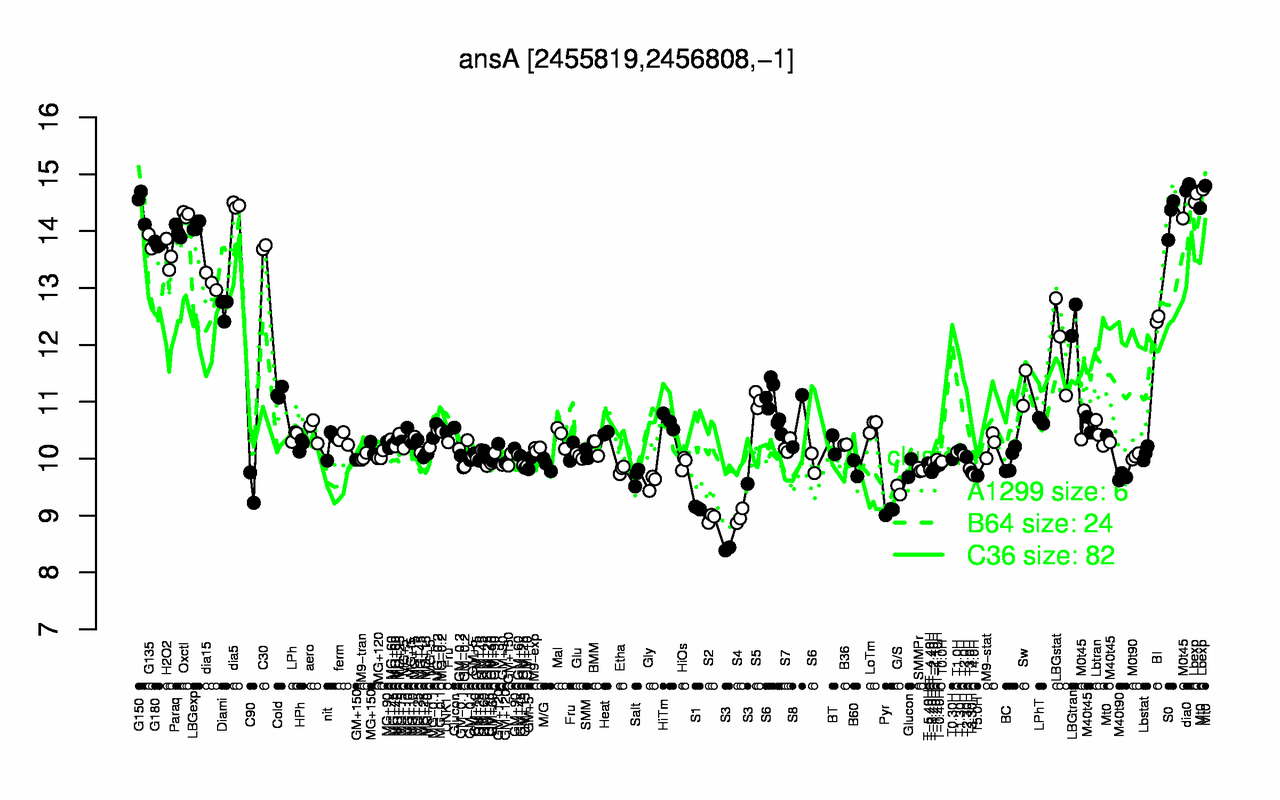
| dia0 | Lbexp | G150 | dia5 | Oxctl | S0 | LBGexp | Paraq | G135 | G180 |
| 14.8 | 14.6 | 14.5 | 14.5 | 14.3 | 14.2 | 14.1 | 14 | 13.8 | 13.8 |
| S3 | S2 | S4 | Pyr | S1 | G/S | C90 | Gly | M40t90 | Salt |
| 8.79 | 8.96 | 8.98 | 9.08 | 9.13 | 9.45 | 9.49 | 9.59 | 9.68 | 9.69 |