| Start Page |
|
 |
| Start Page |
|
|
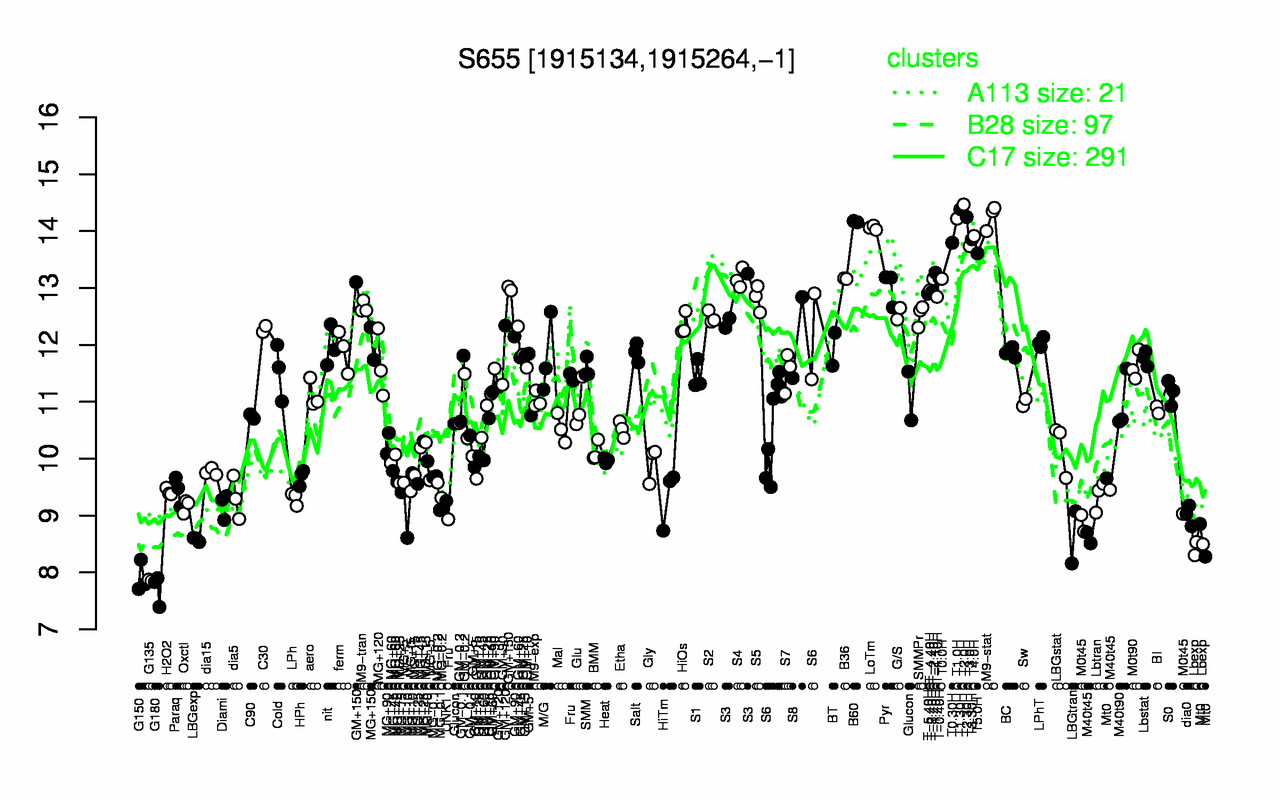
| T2.0H | T1.30H | M9-stat | T2.30H | T1.0H | B60 | LoTm | T4.0H | T3.30H | T0.30H |
| 14.5 | 14.4 | 14.3 | 14.2 | 14.2 | 14.2 | 14.1 | 13.9 | 13.9 | 13.8 |
| G180 | G135 | G150 | Lbexp | LBGexp | LBGtran | M40t45 | M0t45 | Mt0 | dia0 |
| 7.71 | 7.86 | 7.91 | 8.44 | 8.58 | 8.62 | 8.89 | 8.92 | 8.93 | 9.01 |