B. subtilis Expression Data Browser
Start Page
B. subtilis Expression Data Browser
Gene/Segment:
aslA
Locus Tag:
BSU39900
Details about aslA
Show/Hide
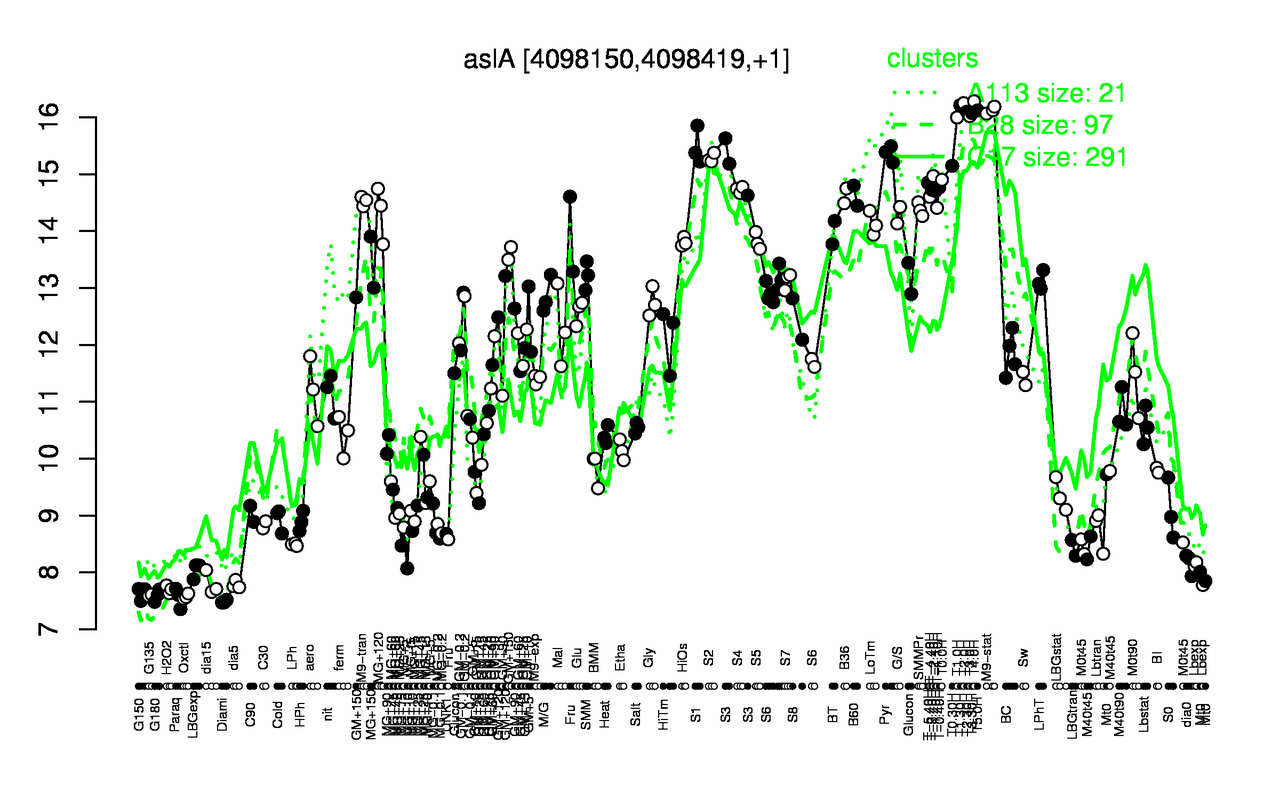
Highest Expression Conditions
T4.0H
T2.0H
T1.30H
M9-stat
T5.0H
T2.30H
T3.30H
T3.0H
T1.0H
S1
16.3
16.2
16.2
16.1
16.1
16.1
16.1
16
16
15.5
Lowest Expression Conditions
Diami
Paraq
Oxctl
G180
G135
G150
H2O2
dia5
dia15
Lbexp
7.49
7.56
7.58
7.6
7.6
7.64
7.7
7.79
7.8
8.02
Most Positively Correlated Segments
yxbB
yxnB
yxbC
S1534
yxaM
asnH
S254
dppB
skfA
dppD
1
0.99
0.96
0.95
0.94
0.94
0.9
0.9
0.89
0.88
Most Negatively Correlated Segments
pta
ykbA
mnaA
yddR
hslO
yurR
ytbE
ytbD
yugK
serS
-0.83
-0.8
-0.79
-0.79
-0.78
-0.78
-0.78
-0.78
-0.78
-0.78
Expression Profile of Segment aslA
Show/Hide
Annotation of Gene aslA
Show/Hide
function
16.13: Shape
inference
ab initio prediction:AMIGene:2.0
codon_start
1
product
D-Aspartate ligase
transl_table
11
note
Evidence 2a: Function of homologous gene experimentally demonstrated in an other organism; PubMedId: 17083466; Product type e: enzyme
db_xref
GI:2636536
protein_id
CAB16026.1
Genomic View of Gene/Segment aslA
Show/Hide
(Legend)
Browse Genome Context