| Start Page |
|
 |
| Start Page |
|
|
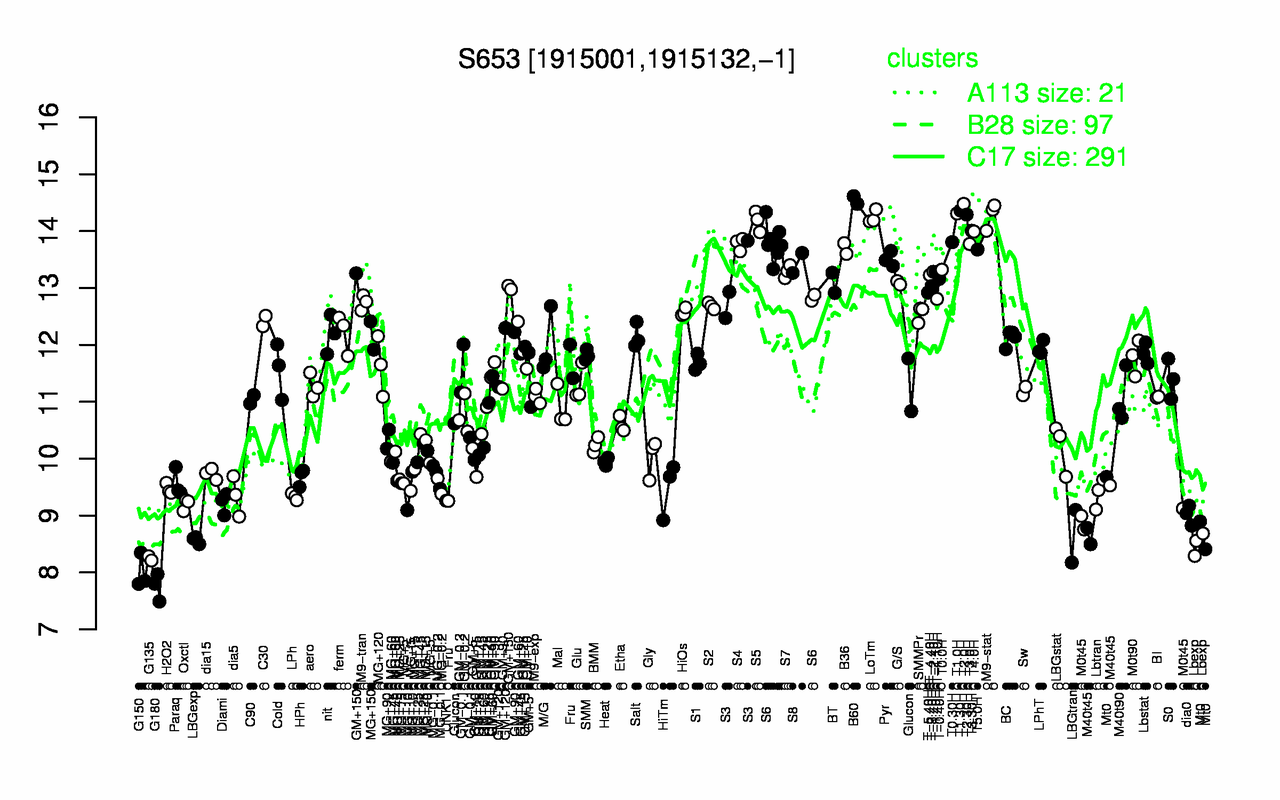
| B60 | T2.0H | T1.30H | T1.0H | T2.30H | M9-stat | LoTm | S5 | T3.30H | T4.0H |
| 14.5 | 14.5 | 14.4 | 14.3 | 14.3 | 14.3 | 14.2 | 14.2 | 14 | 14 |
| G180 | G150 | G135 | Lbexp | LBGexp | LBGtran | M40t45 | M0t45 | Mt0 | dia0 |
| 7.75 | 8 | 8.25 | 8.51 | 8.57 | 8.64 | 8.94 | 8.96 | 8.99 | 9.01 |