| Start Page |
|
 |
| Start Page |
|
|
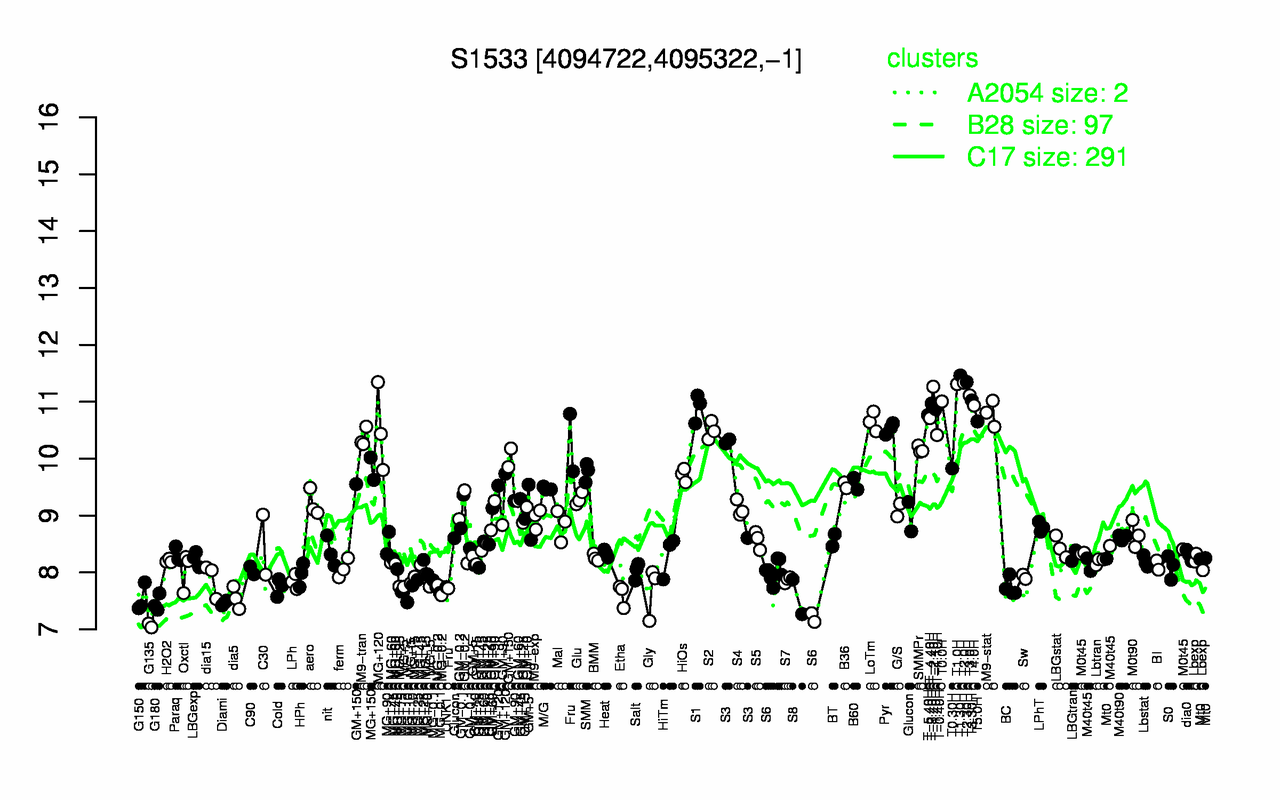
| T1.30H | T2.30H | T2.0H | T1.0H | T-2.40H | T3.0H | T3.30H | T0.0H | T-0.40H | T-3.40H |
| 11.5 | 11.3 | 11.3 | 11.3 | 11.3 | 11.1 | 11 | 11 | 11 | 11 |
| G135 | G180 | Diami | G150 | dia5 | S8 | Etha | Gly | MG-0.2 | MG+10 |
| 7.07 | 7.46 | 7.46 | 7.54 | 7.55 | 7.57 | 7.61 | 7.68 | 7.69 | 7.74 |