| Start Page |
|
 |
| Start Page |
|
|
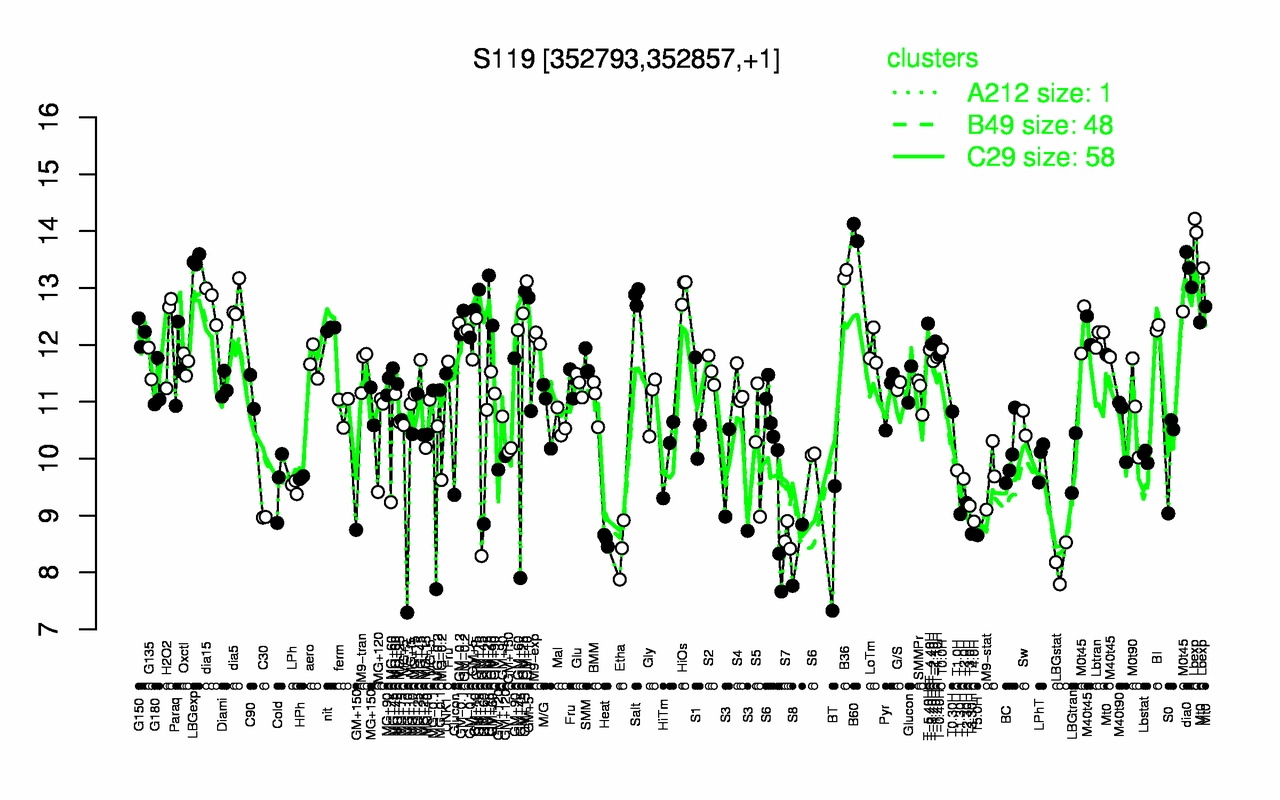
| B60 | Lbexp | LBGexp | dia0 | B36 | HiOs | GM+15 | GM+10 | Salt | dia5 |
| 14 | 13.8 | 13.5 | 13.3 | 13.2 | 13 | 12.9 | 12.9 | 12.9 | 12.8 |
| LBGstat | S8 | Etha | BT | Heat | S7 | T5.0H | T3.30H | T4.0H | C30 |
| 8.17 | 8.3 | 8.41 | 8.42 | 8.57 | 8.62 | 8.65 | 8.68 | 8.89 | 8.97 |