| Start Page |
|
 |
| Start Page |
|
|
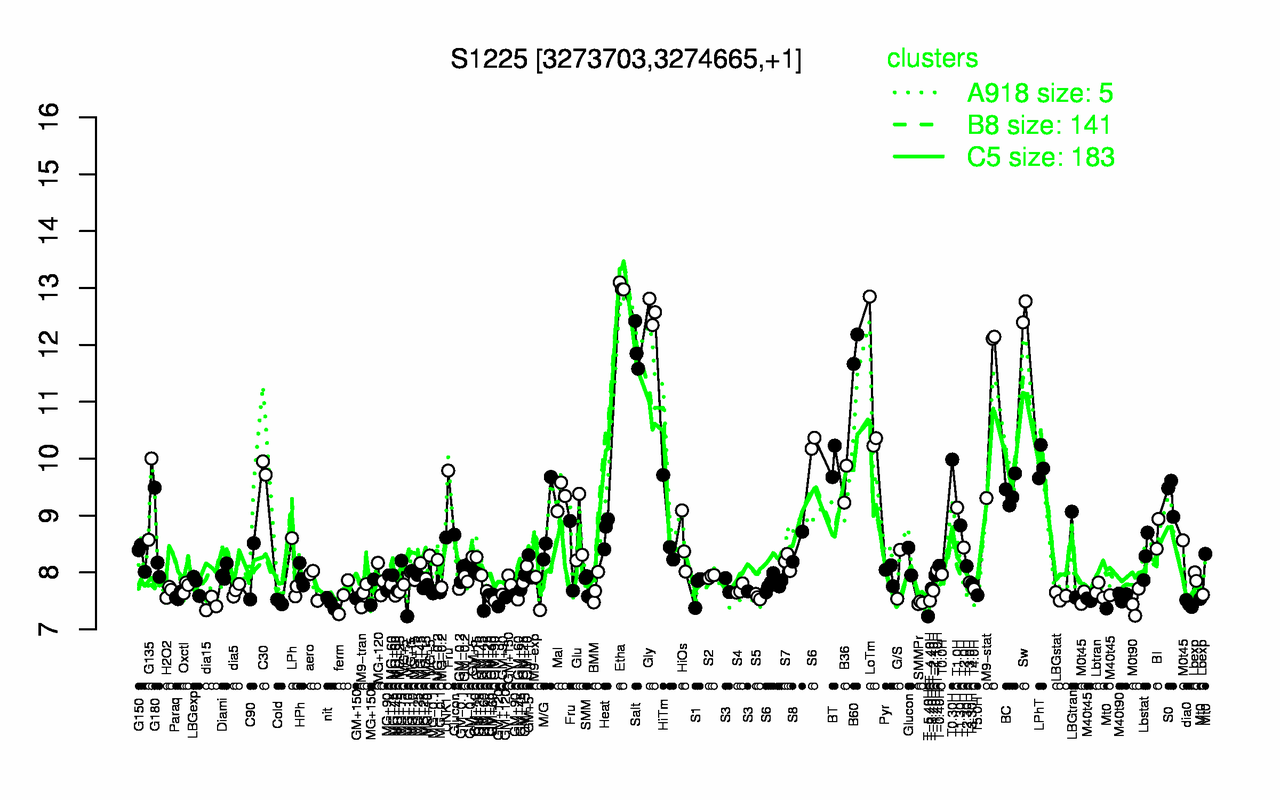
| Etha | Sw | Gly | Salt | B60 | M9-stat | LoTm | T0.30H | BT | LPhT |
| 13 | 12.6 | 12.6 | 11.9 | 11.9 | 11.2 | 11.1 | 9.98 | 9.95 | 9.91 |
| T-5.40H | dia15 | dia0 | nit | M0t90 | SMMPr | GM+120 | GM+60 | Cold | T-4.40H |
| 7.23 | 7.44 | 7.45 | 7.46 | 7.47 | 7.47 | 7.48 | 7.49 | 7.49 | 7.5 |