| Start Page |
|
 |
| Start Page |
|
|
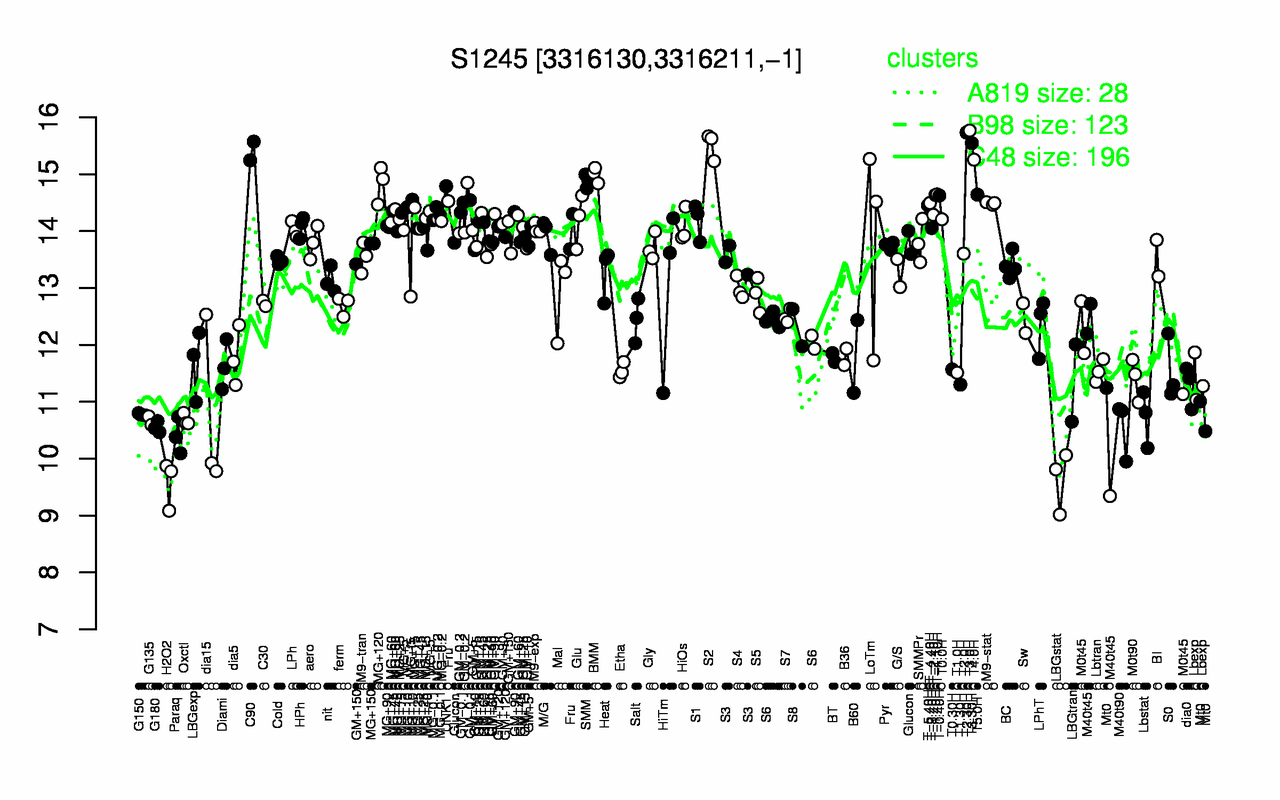
| T3.0H | T2.30H | T3.30H | S2 | C90 | T4.0H | BMM | SMM | MG+120 | UNK1 |
| 15.8 | 15.7 | 15.5 | 15.5 | 15.4 | 15.3 | 15 | 14.9 | 14.8 | 14.8 |
| H2O2 | LBGstat | Paraq | M40t90 | G180 | G135 | Oxctl | Lbstat | dia15 | G150 |
| 9.58 | 9.63 | 10.4 | 10.6 | 10.6 | 10.7 | 10.7 | 10.7 | 10.7 | 10.8 |