| Start Page |
|
 |
| Start Page |
|
|
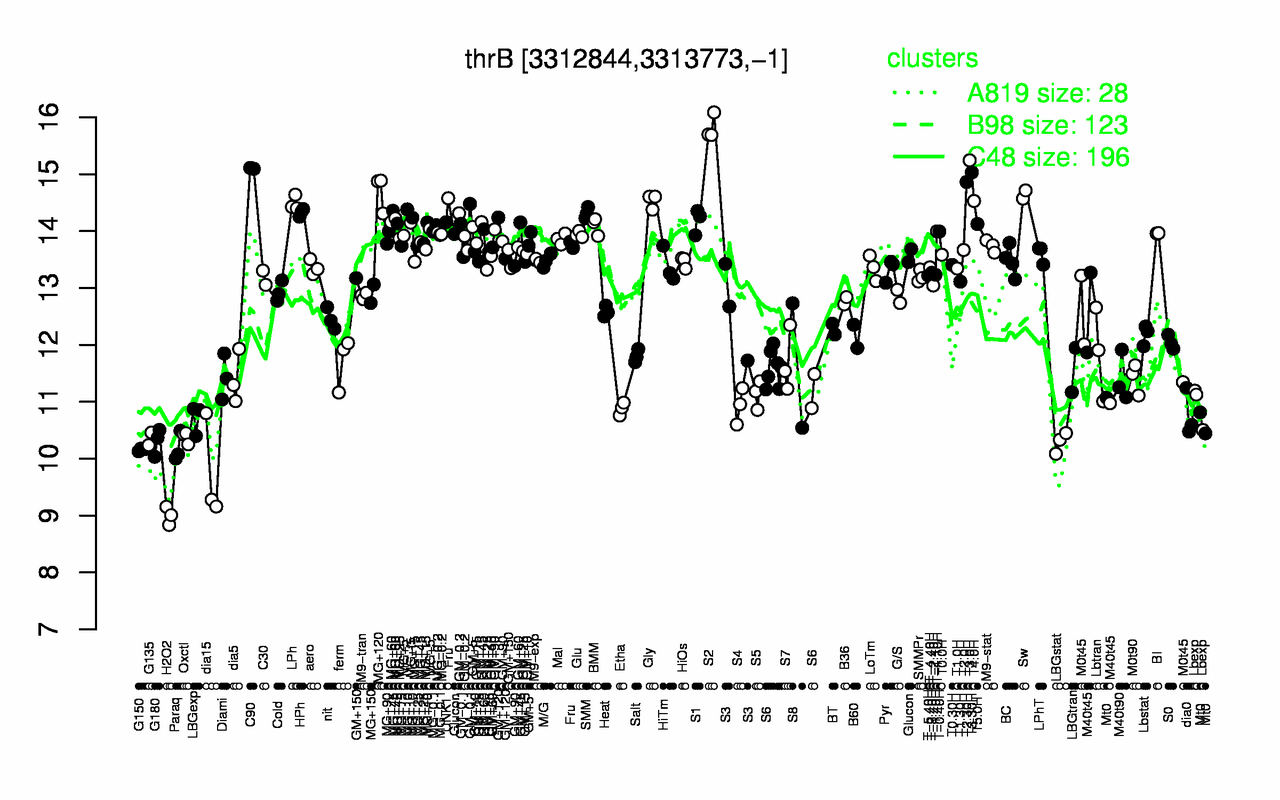
| S2 | T3.0H | C90 | T3.30H | T2.30H | MG+120 | Sw | Gly | T4.0H | LPh |
| 15.8 | 15.2 | 15.1 | 15 | 14.9 | 14.7 | 14.6 | 14.5 | 14.5 | 14.5 |
| H2O2 | dia15 | G150 | Paraq | LBGstat | G180 | G135 | Oxctl | LBGexp | dia0 |
| 9 | 9.75 | 10.2 | 10.2 | 10.3 | 10.3 | 10.3 | 10.4 | 10.7 | 10.8 |