B. subtilis Expression Data Browser
Start Page
B. subtilis Expression Data Browser
Gene/Segment:
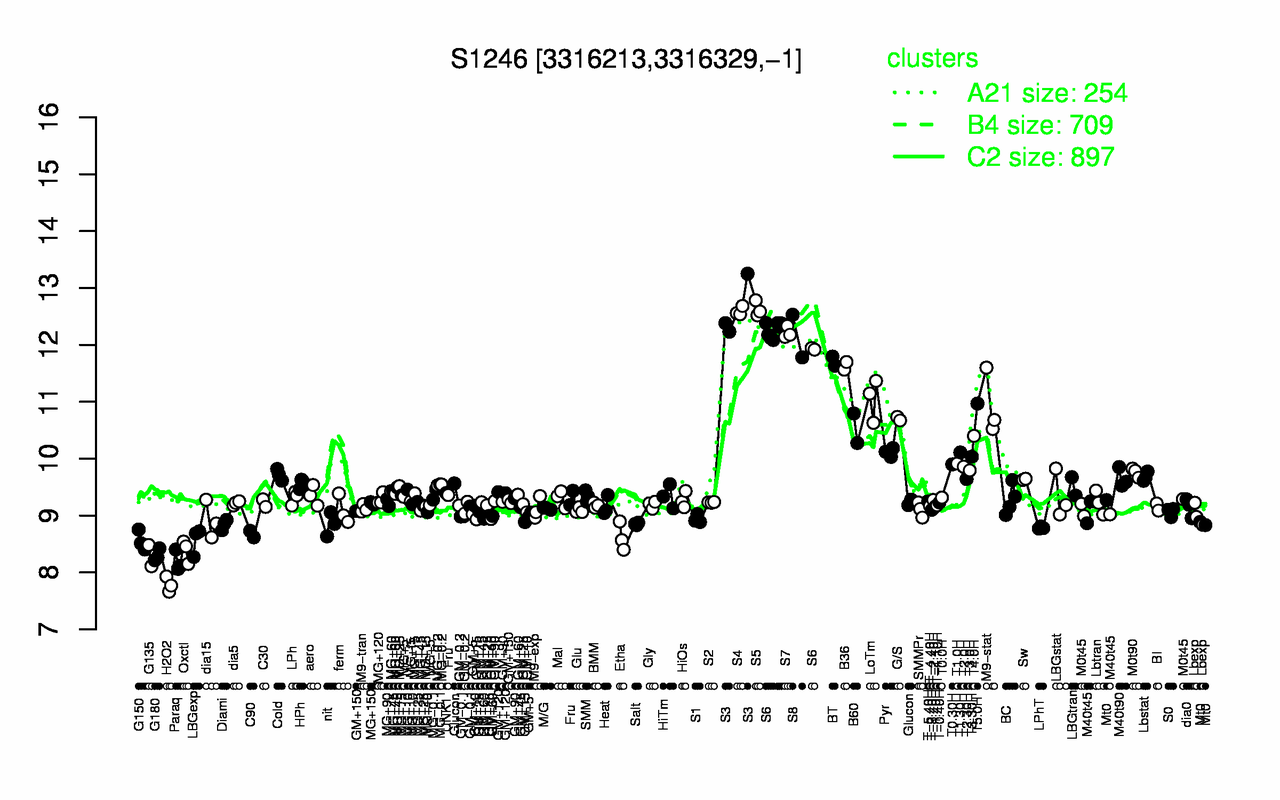
S1246
Locus Tag:
new_3316213_3316329_c
Details about S1246
Show/Hide
Highest Expression Conditions
S5
S3
S4
S7
S6
S8
BT
B36
LoTm
T5.0H
12.6
12.6
12.6
12.2
12.2
12.2
11.7
11.6
11
11
Lowest Expression Conditions
H2O2
Paraq
G135
G180
Oxctl
G150
LBGexp
Etha
C90
LPhT
7.79
8.19
8.3
8.3
8.38
8.56
8.56
8.62
8.67
8.79
Most Positively Correlated Segments
yutH
yngI
yngHA
yhfW
S1445
S369
yqhH
glnM
yngHB
S452
0.96
0.92
0.92
0.92
0.92
0.92
0.92
0.92
0.92
0.91
Most Negatively Correlated Segments
S378
yvrG
yeaC
sbcD
S1480
yeaD
ywfO
dltD
dltC
ywdF
-0.88
-0.87
-0.87
-0.87
-0.87
-0.86
-0.86
-0.86
-0.85
-0.85
Expression Profile of Segment S1246
Show/Hide
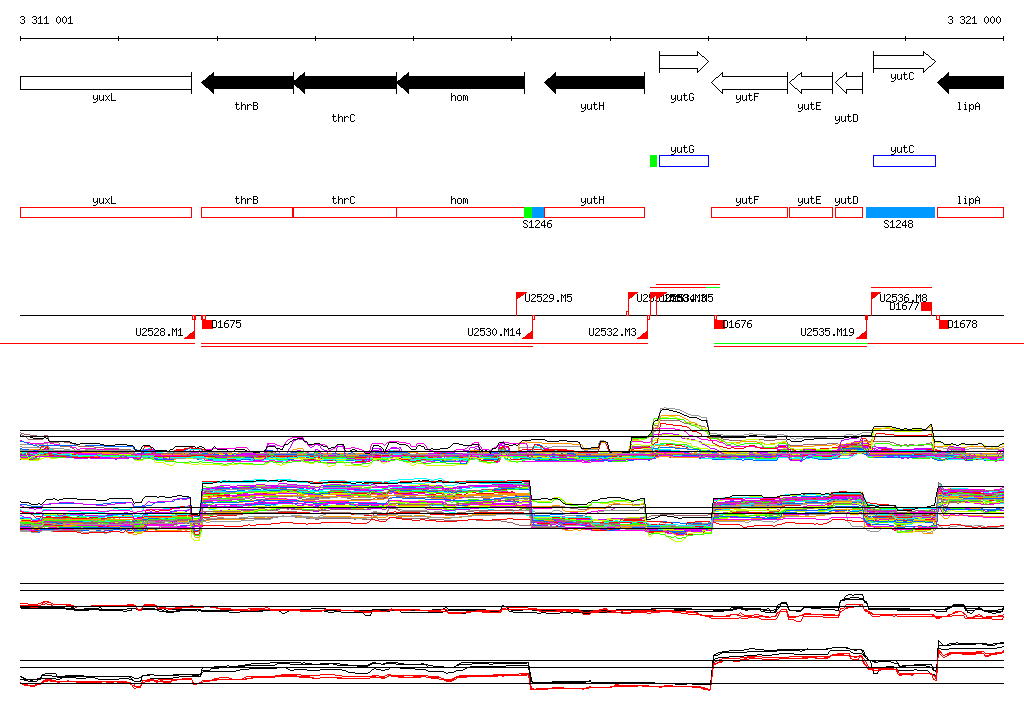
Genomic View of Gene/Segment S1246
Show/Hide
(Legend)
Browse Genome Context