| Start Page |
|
 |
| Start Page |
|
|
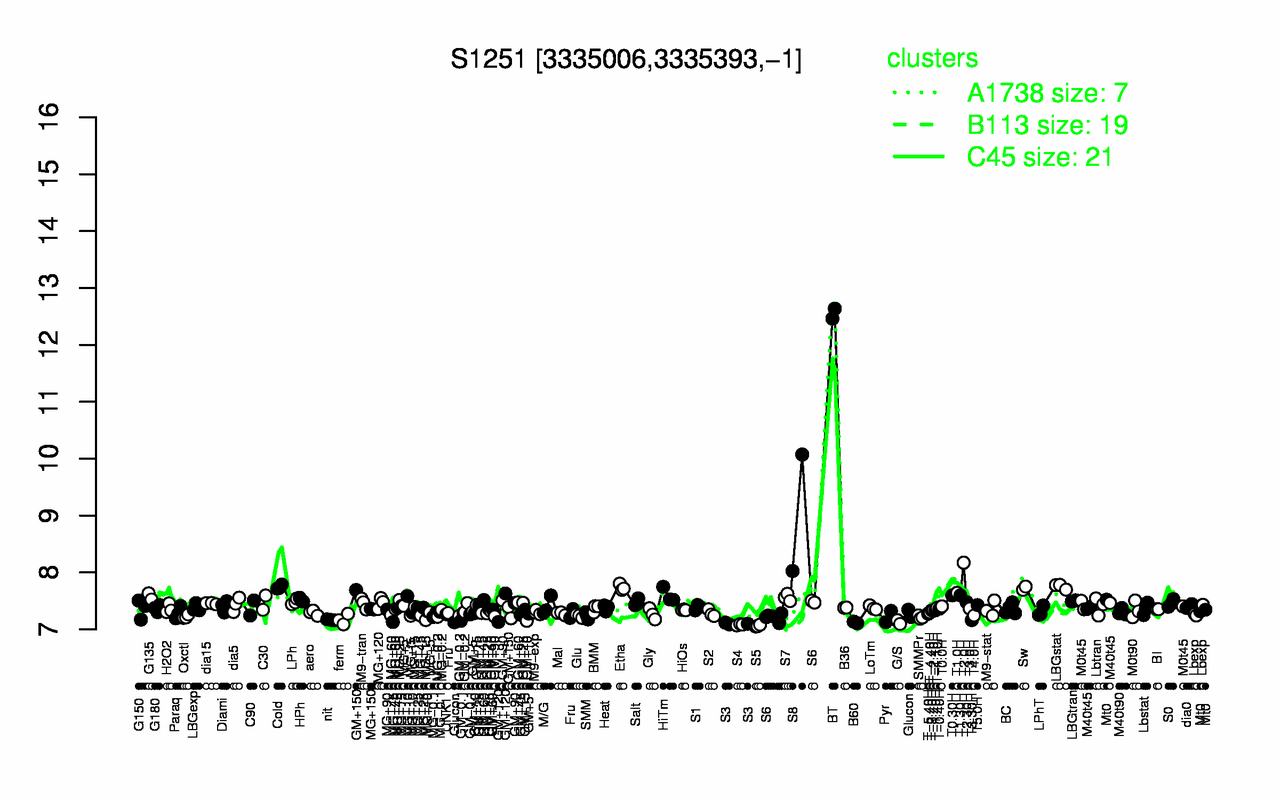
| BT | S8 | T2.0H | LBGstat | Cold | Etha | Sw | T1.0H | T1.30H | T0.30H |
| 12.5 | 9.05 | 8.17 | 7.75 | 7.74 | 7.74 | 7.72 | 7.64 | 7.6 | 7.6 |
| S5 | S4 | S3 | B60 | G/S | T3.30H | nit | ferm | Pyr | SMMPr |
| 7.06 | 7.08 | 7.1 | 7.12 | 7.13 | 7.16 | 7.17 | 7.17 | 7.21 | 7.21 |