| Start Page |
|
 |
| Start Page |
|
|
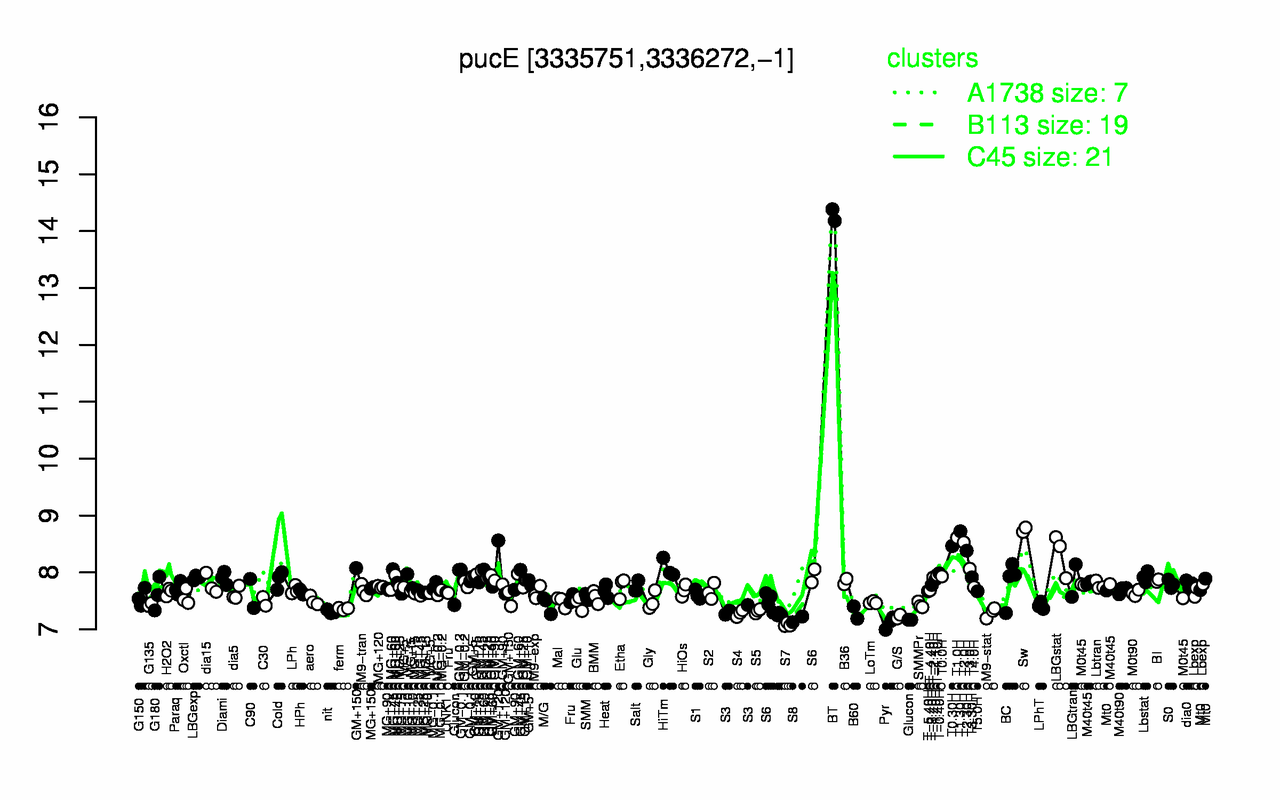
| BT | Sw | T1.30H | T1.0H | T2.0H | T0.30H | T2.30H | LBGstat | GM+120 | HiTm |
| 14.3 | 8.75 | 8.72 | 8.61 | 8.53 | 8.46 | 8.38 | 8.33 | 8.09 | 8.07 |
| S7 | Pyr | S8 | G/S | Glucon | S4 | M9-stat | B60 | nit | S5 |
| 7.08 | 7.12 | 7.18 | 7.22 | 7.25 | 7.28 | 7.3 | 7.3 | 7.31 | 7.32 |