B. subtilis Expression Data Browser
Start Page
B. subtilis Expression Data Browser
Gene/Segment:
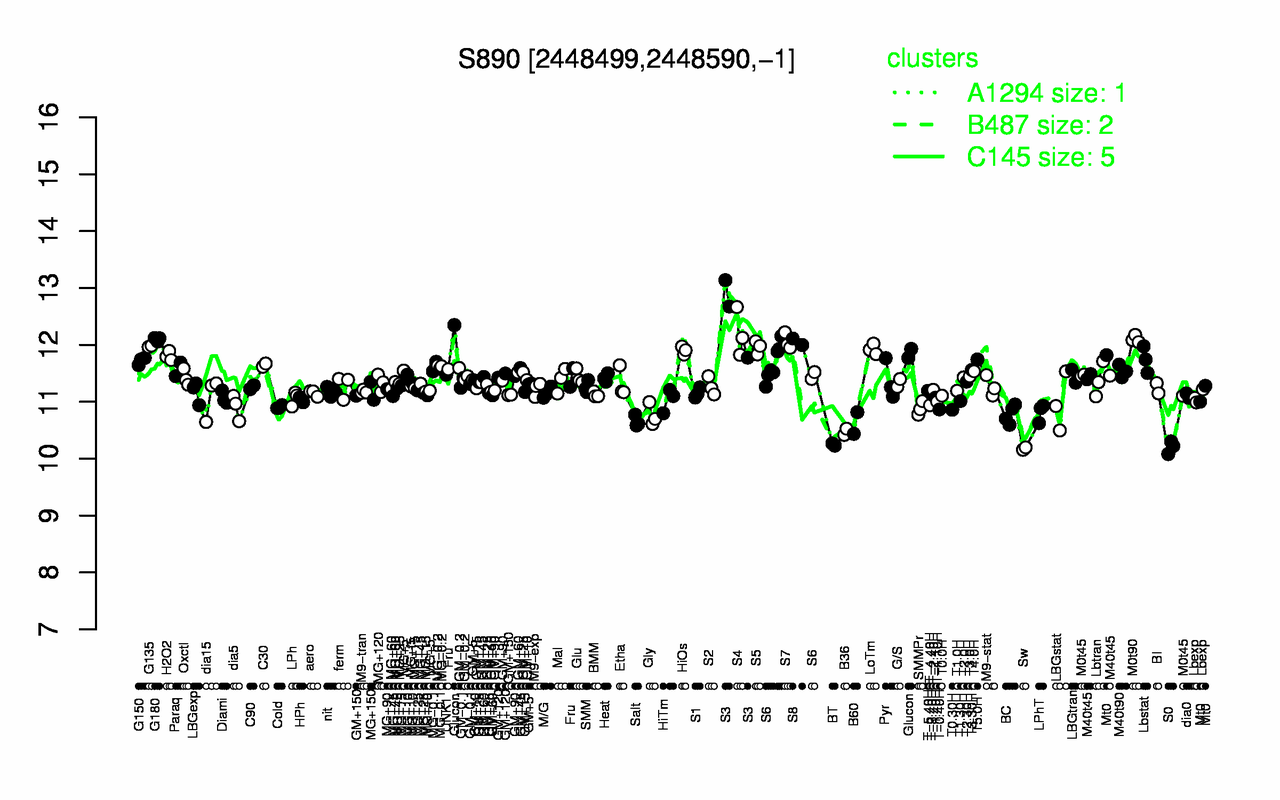
S890
Locus Tag:
new_2448499_2448590_c
Details about S890
Show/Hide
Highest Expression Conditions
S3
S4
M0t90
G180
S7
S8
Glucon
G135
S5
LoTm
12.5
12.2
12.1
12.1
12.1
12.1
12
12
12
11.9
Lowest Expression Conditions
Sw
S0
BT
B36
B60
Salt
Gly
BC
LPhT
T0.30H
10.2
10.2
10.2
10.5
10.6
10.7
10.8
10.8
10.8
10.9
Most Positively Correlated Segments
ripX
miaA
S1090
S207
ylbL
yqzK
S868
ypfB
yrzK
S667
0.78
0.55
0.54
0.51
0.5
0.49
0.48
0.48
0.47
0.47
Most Negatively Correlated Segments
ycxA
S224
yqjN
S1497
csbB
S89
bdhA
rsbV
yceD
yceF
-0.5
-0.49
-0.47
-0.46
-0.46
-0.45
-0.45
-0.45
-0.44
-0.44
Expression Profile of Segment S890
Show/Hide
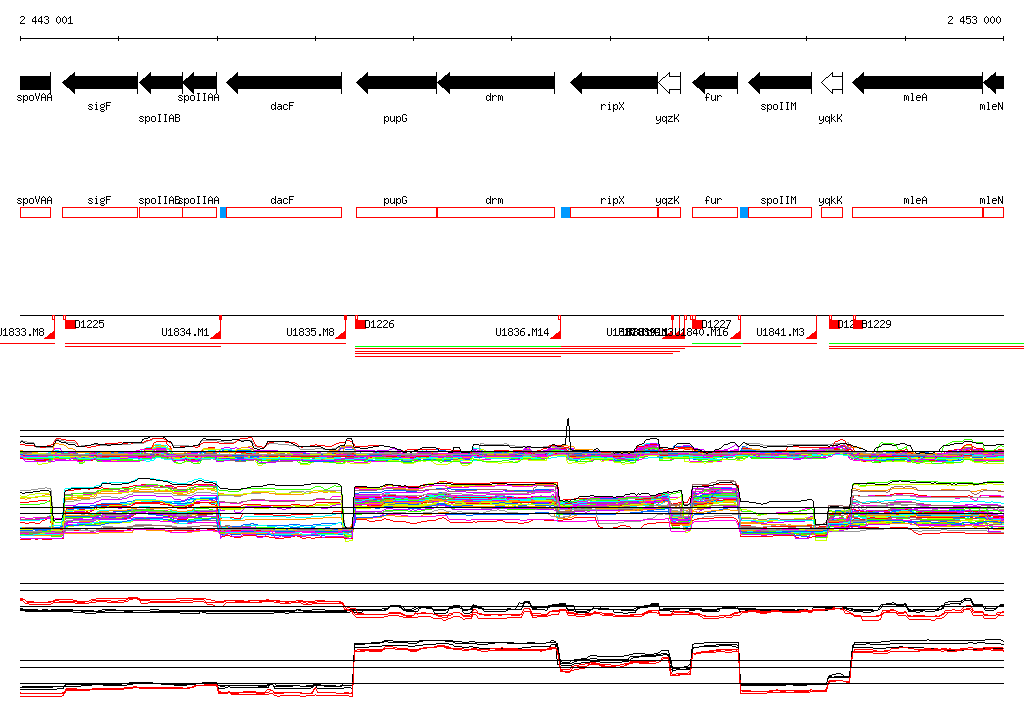
Genomic View of Gene/Segment S890
Show/Hide
(Legend)
Browse Genome Context