B. subtilis Expression Data Browser
Start Page
B. subtilis Expression Data Browser
Gene/Segment:
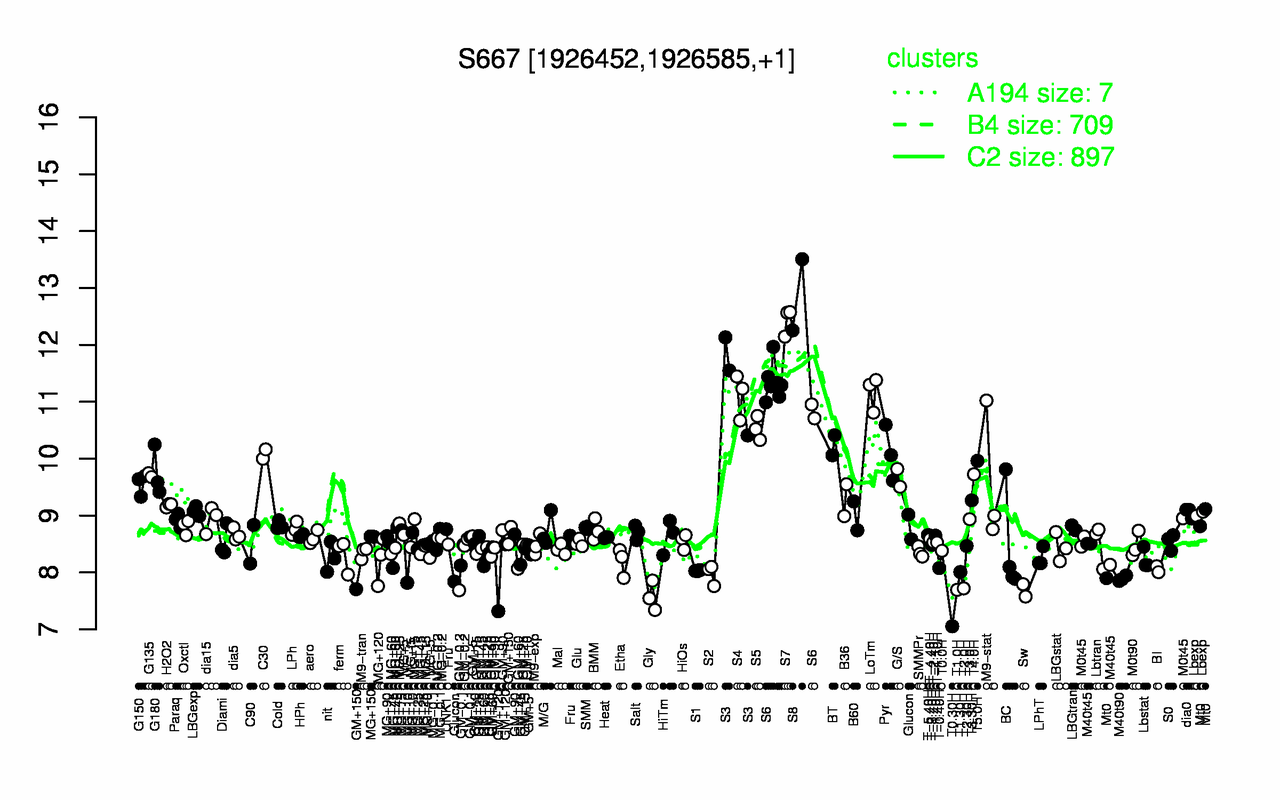
S667
Locus Tag:
new_1926452_1926585
Details about S667
Show/Hide
Highest Expression Conditions
S8
S7
S3
S6
LoTm
S4
S5
BT
Pyr
C30
12.9
12.4
11.4
11.2
11.2
11.1
10.5
10.2
10.1
10.1
Lowest Expression Conditions
T0.30H
Gly
Sw
T1.0H
T2.0H
M40t90
GM+120
S2
T1.30H
S1
7.05
7.58
7.68
7.69
7.72
7.89
7.91
7.97
8.01
8.03
Most Positively Correlated Segments
stoA
yphA
yjbE
S705
S533
ypzH
yrzK
S111
yjaV
S1183
0.88
0.87
0.87
0.87
0.87
0.87
0.86
0.86
0.86
0.85
Most Negatively Correlated Segments
yceH
yceG
yceE
yceD
addA
addB
yceF
yugH
bceS
bceR
-0.81
-0.81
-0.79
-0.79
-0.79
-0.78
-0.78
-0.77
-0.77
-0.76
Expression Profile of Segment S667
Show/Hide
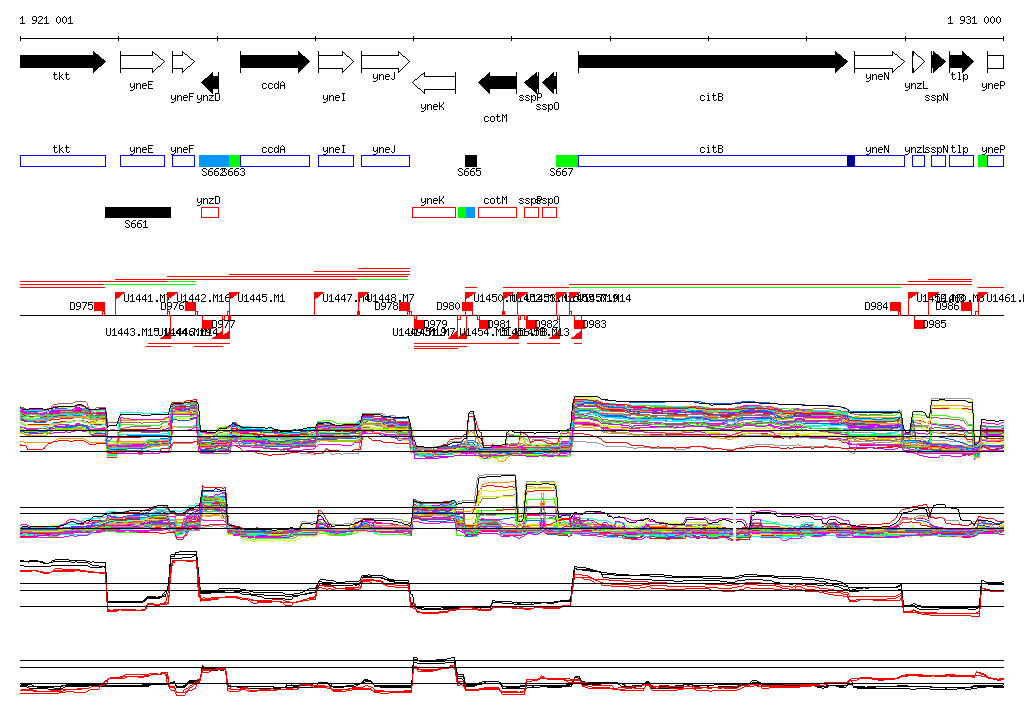
Genomic View of Gene/Segment S667
Show/Hide
(Legend)
Browse Genome Context