| Start Page |
|
 |
| Start Page |
|
|
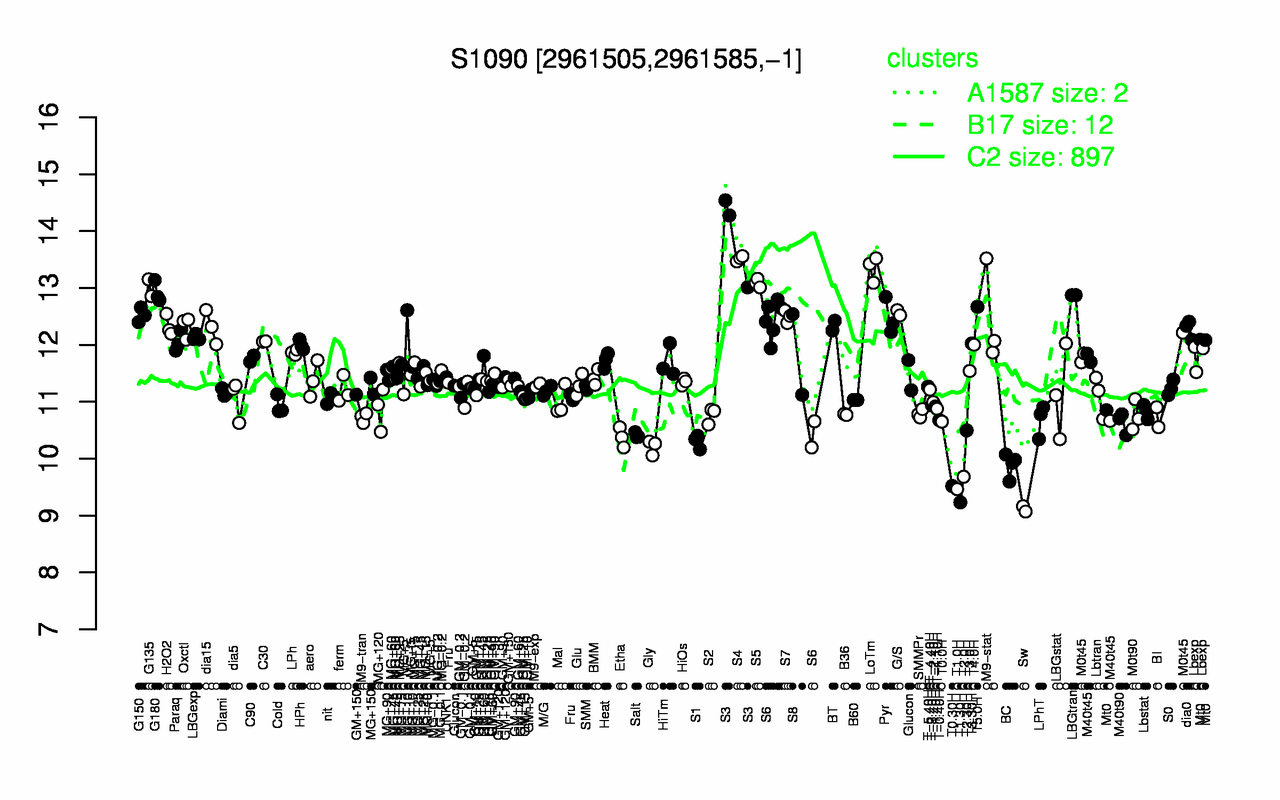
| S3 | S4 | LoTm | S5 | G135 | G180 | LBGtran | T5.0H | G/S | G150 |
| 13.9 | 13.5 | 13.3 | 13.1 | 13 | 12.9 | 12.9 | 12.7 | 12.6 | 12.5 |
| Sw | T1.30H | T1.0H | T0.30H | T2.0H | BC | Gly | S1 | Etha | Salt |
| 9.12 | 9.23 | 9.46 | 9.52 | 9.68 | 9.89 | 10.2 | 10.3 | 10.4 | 10.4 |