| Start Page |
|
 |
| Start Page |
|
|
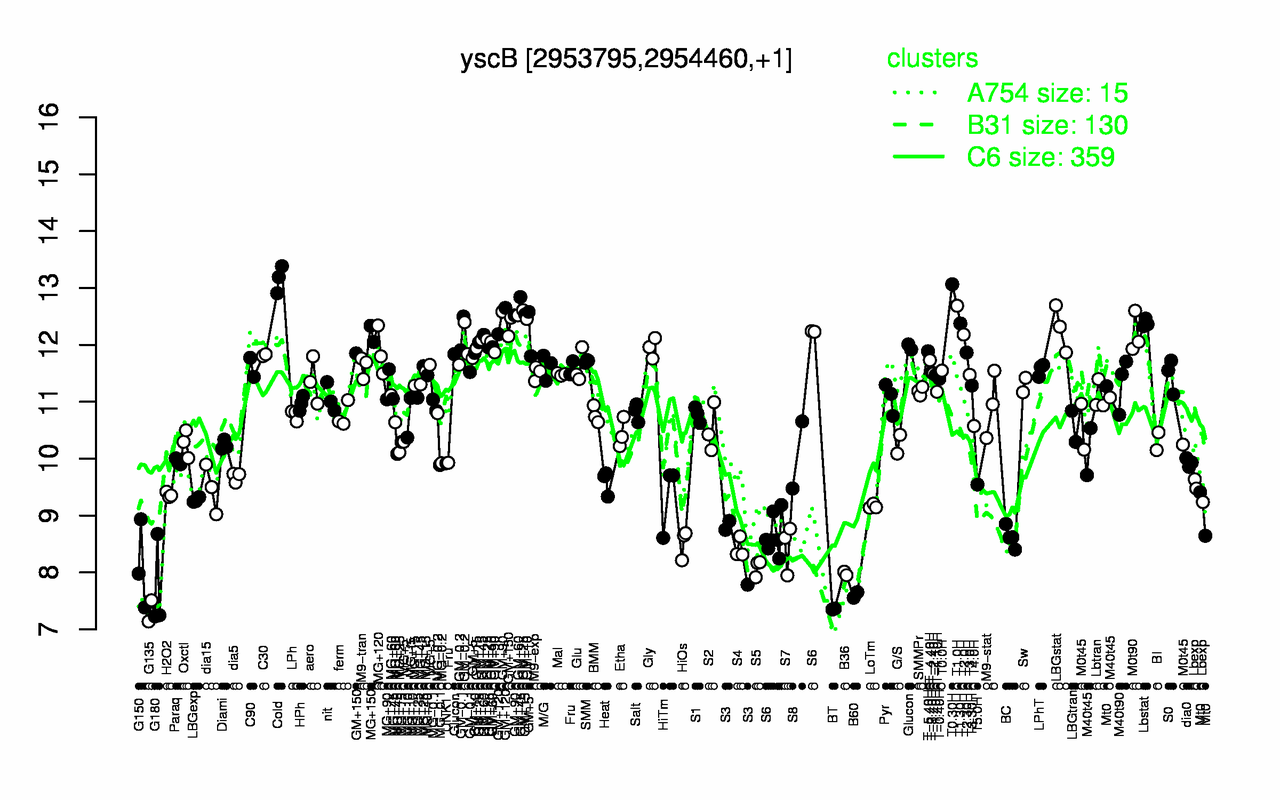
| Cold | T0.30H | T1.0H | GM+120 | Lbstat | T1.30H | GM+45 | GM+90 | LBGstat | GM+25 |
| 13.2 | 13.1 | 12.7 | 12.4 | 12.4 | 12.4 | 12.3 | 12.3 | 12.3 | 12.2 |
| G135 | BT | B60 | G180 | B36 | S5 | G150 | S4 | S7 | S3 |
| 7.32 | 7.36 | 7.6 | 7.72 | 7.98 | 8.09 | 8.1 | 8.42 | 8.44 | 8.48 |