| Start Page |
|
 |
| Start Page |
|
|
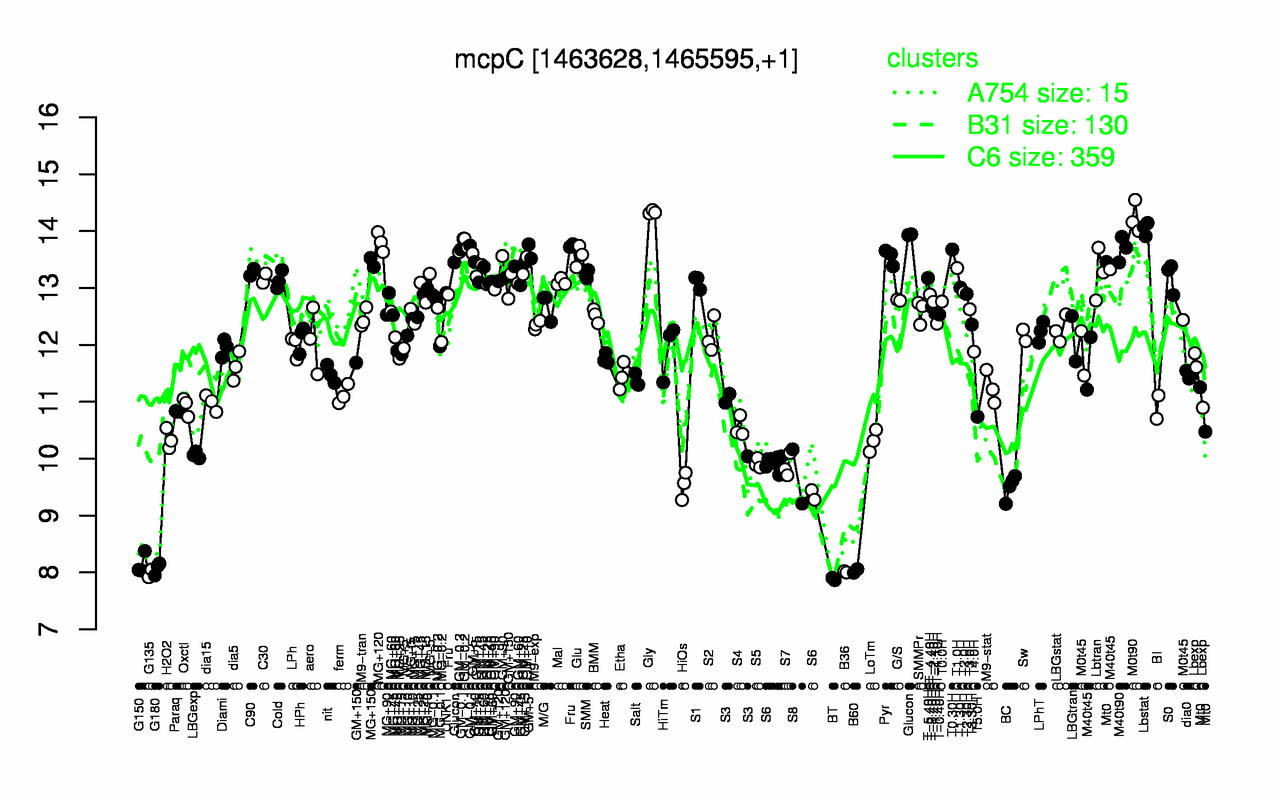
| Gly | M0t90 | Lbstat | MG+120 | Glucon | GM-0.1 | GM-0.2 | M40t90 | T0.30H | GM+5 |
| 14.3 | 14.2 | 14 | 13.8 | 13.8 | 13.8 | 13.7 | 13.7 | 13.7 | 13.6 |
| BT | G135 | B36 | B60 | G180 | G150 | BC | HiOs | S8 | S6 |
| 7.88 | 7.98 | 8.01 | 8.03 | 8.07 | 8.15 | 9.51 | 9.53 | 9.69 | 9.81 |