B. subtilis Expression Data Browser
Details about flgM Show/Hide
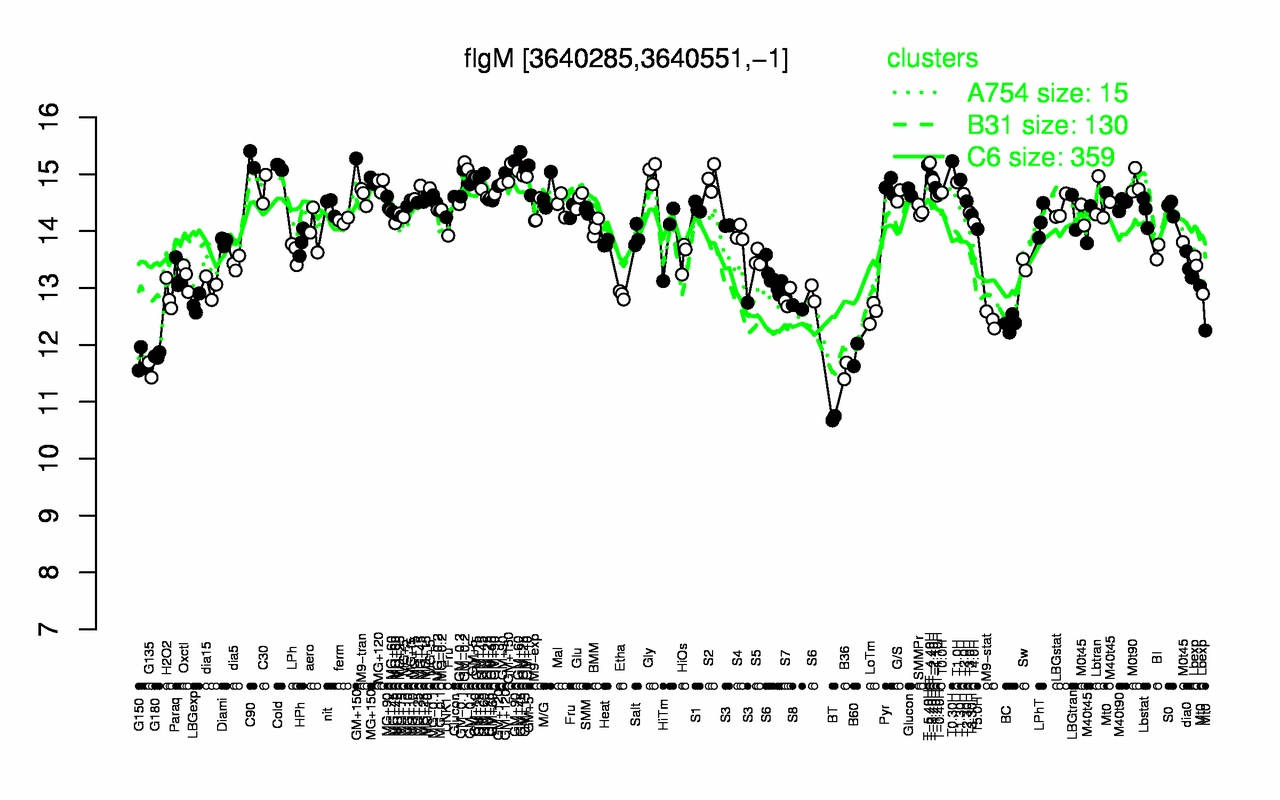
Highest Expression Conditions
C90 T0.30H T-4.40H T-5.40H Cold GM+150 Gly GM+10 T-3.40H S2
15.3 15.2 15.2 15.2 15.1 15.1 15 14.9 14.9 14.9
Lowest Expression Conditions
BT B36 G135 G150 G180 B60 BC M9-stat LoTm S8
10.7 11.5 11.6 11.7 11.8 11.8 12.4 12.4 12.6 12.7
Most Positively Correlated Segments
yvyG S1353 yvyF flgK flgL cheV mcpC ybdO yomK yjfB
0.98 0.98 0.95 0.92 0.91 0.9 0.89 0.84 0.84 0.84
Most Negatively Correlated Segments
dtpT S603 yclG ymfI yfkO yitT yckC yunB spoIIR yxiT
-0.71 -0.65 -0.63 -0.63 -0.61 -0.61 -0.6 -0.6 -0.59 -0.59
Expression Profile of Segment flgM Show/Hide
Annotation of Gene flgM Show/Hide
function
16.3: Control
inference
ab initio prediction:AMIGene:2.0
codon_start
1
product
anti-sigma factor repressor of sigma(D)-dependent transcription
transl_table
11
note
Evidence 1a: Function experimentally demonstrated in the studied strain; PubMedId: 10207036, 10322161, 14762011, 16673084; Product type r: regulator
db_xref
GI:2636069
protein_id
CAB15560.1
Genomic View of Gene/Segment flgM Show/Hide
(Legend)