| Start Page |
|
 |
| Start Page |
|
|
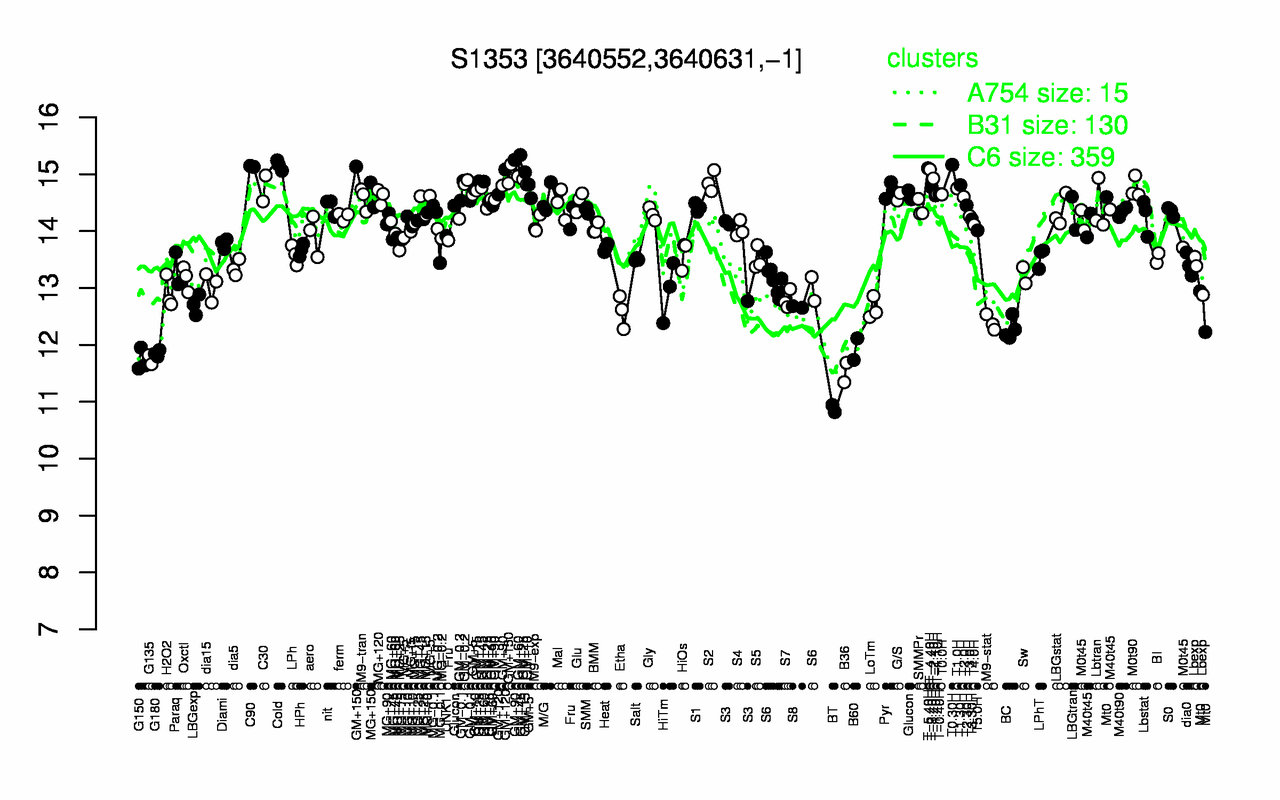
| T0.30H | Cold | C90 | T-5.40H | T-4.40H | GM+150 | T-2.40H | GM+45 | S2 | GM+90 |
| 15.2 | 15.2 | 15.1 | 15.1 | 15.1 | 15 | 14.9 | 14.9 | 14.9 | 14.9 |
| BT | B36 | G150 | G135 | G180 | B60 | BC | M9-stat | Etha | LoTm |
| 10.9 | 11.5 | 11.7 | 11.7 | 11.8 | 11.9 | 12.3 | 12.4 | 12.6 | 12.6 |