| Start Page |
|
 |
| Start Page |
|
|
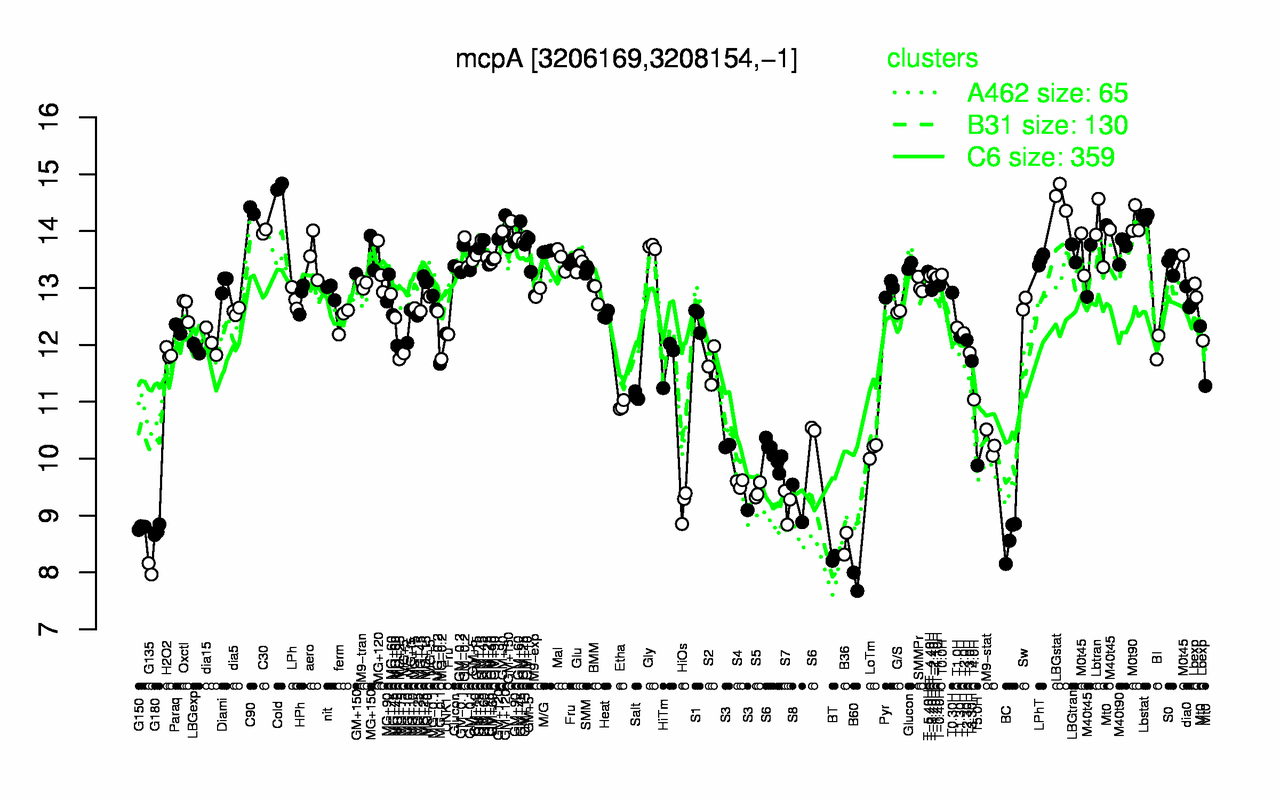
| Cold | LBGstat | C90 | Lbstat | M0t90 | GM+120 | C30 | Lbtran | GM+45 | GM+90 |
| 14.8 | 14.6 | 14.4 | 14.3 | 14.2 | 14.1 | 14 | 14 | 13.8 | 13.8 |
| B60 | G135 | BT | B36 | BC | G180 | G150 | HiOs | S7 | S8 |
| 7.84 | 8.06 | 8.25 | 8.51 | 8.6 | 8.74 | 8.79 | 9.18 | 9.18 | 9.21 |