| Start Page |
|
 |
| Start Page |
|
|
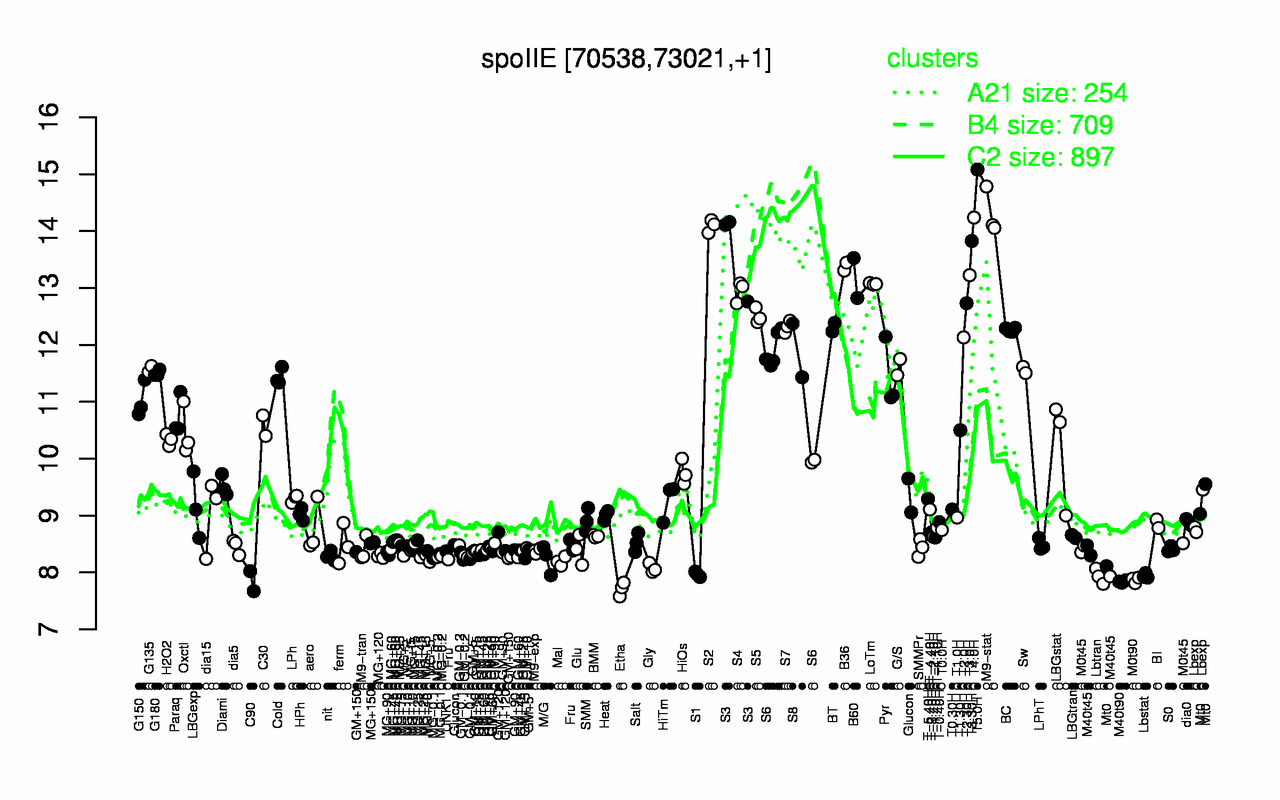
| T5.0H | M9-stat | T4.0H | S2 | T3.30H | S3 | B36 | T3.0H | B60 | LoTm |
| 15.1 | 14.3 | 14.2 | 14.1 | 13.8 | 13.7 | 13.4 | 13.2 | 13.2 | 13.1 |
| Etha | M40t90 | C90 | M0t90 | Lbtran | Lbstat | S1 | Gly | Mal | M40t45 |
| 7.71 | 7.84 | 7.85 | 7.87 | 7.93 | 7.94 | 7.97 | 8.07 | 8.2 | 8.23 |