| Start Page |
|
 |
| Start Page |
|
|
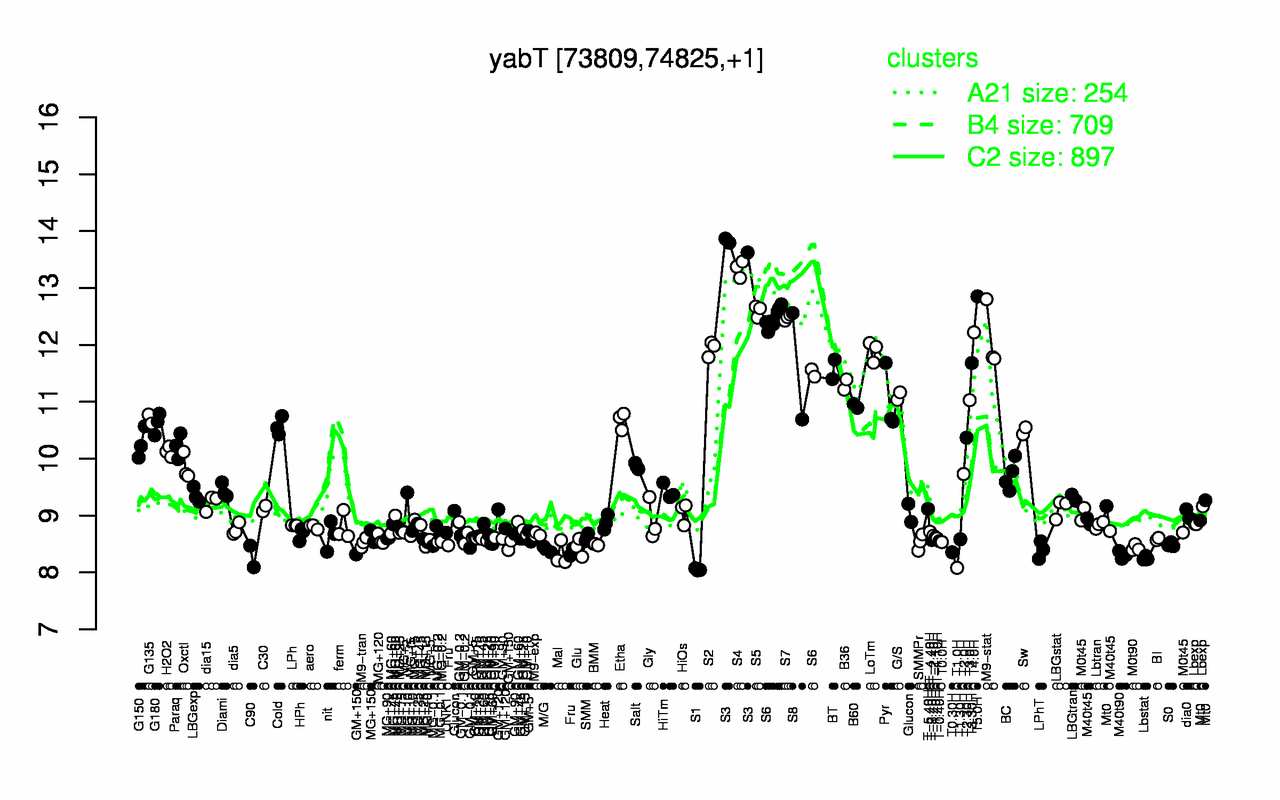
| S3 | S4 | T5.0H | S5 | S7 | S6 | T4.0H | M9-stat | S2 | LoTm |
| 13.8 | 13.3 | 12.9 | 12.6 | 12.5 | 12.3 | 12.2 | 12.1 | 11.9 | 11.9 |
| S1 | T1.0H | Lbstat | C90 | M40t90 | Mal | T0.30H | LPhT | Fru | M/G |
| 8.05 | 8.08 | 8.25 | 8.28 | 8.31 | 8.32 | 8.35 | 8.4 | 8.4 | 8.41 |