| Start Page |
|
 |
| Start Page |
|
|
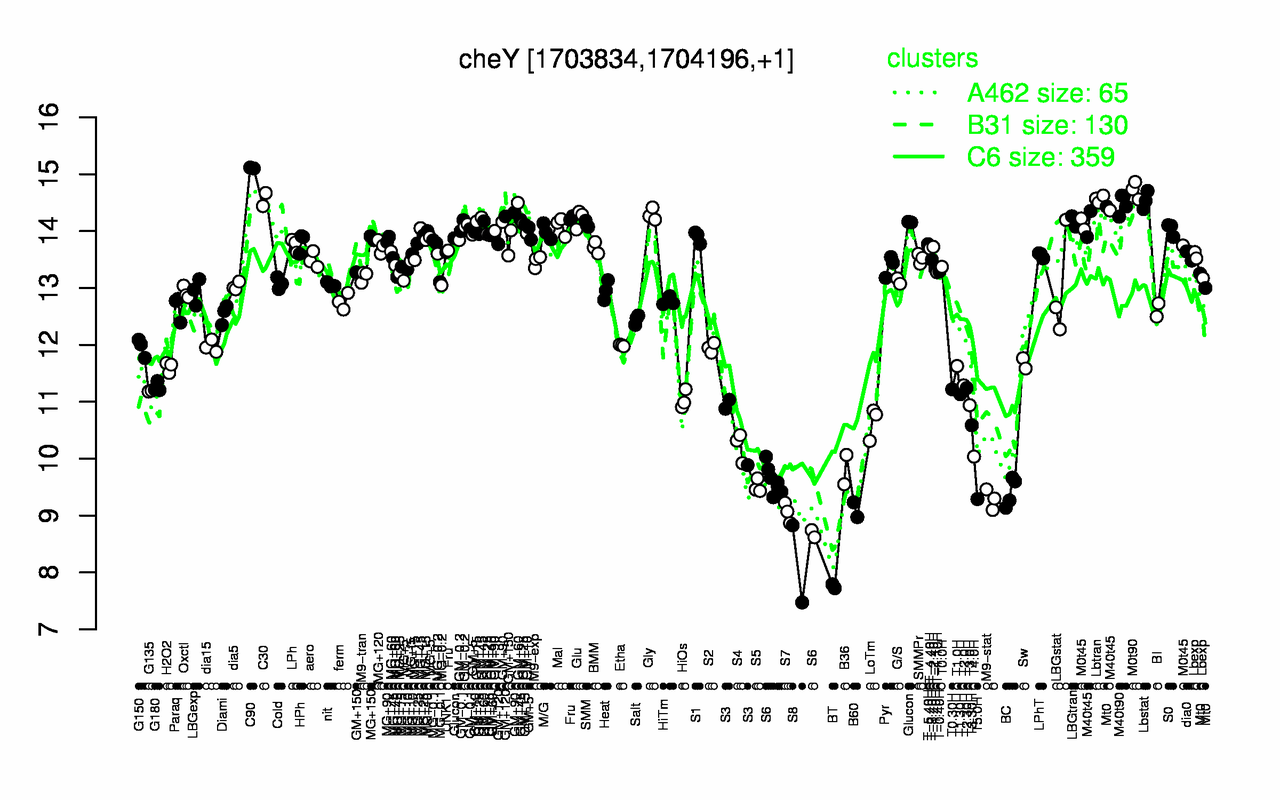
| C90 | M0t90 | Lbtran | C30 | Lbstat | M40t90 | Gly | Glu | M40t45 | GM+60 |
| 15.1 | 14.7 | 14.6 | 14.6 | 14.5 | 14.4 | 14.3 | 14.2 | 14.2 | 14.2 |
| BT | S8 | S7 | B60 | M9-stat | T5.0H | S6 | BC | S5 | B36 |
| 7.76 | 8.15 | 9.05 | 9.1 | 9.29 | 9.29 | 9.4 | 9.42 | 9.51 | 9.81 |