| Start Page |
|
 |
| Start Page |
|
|
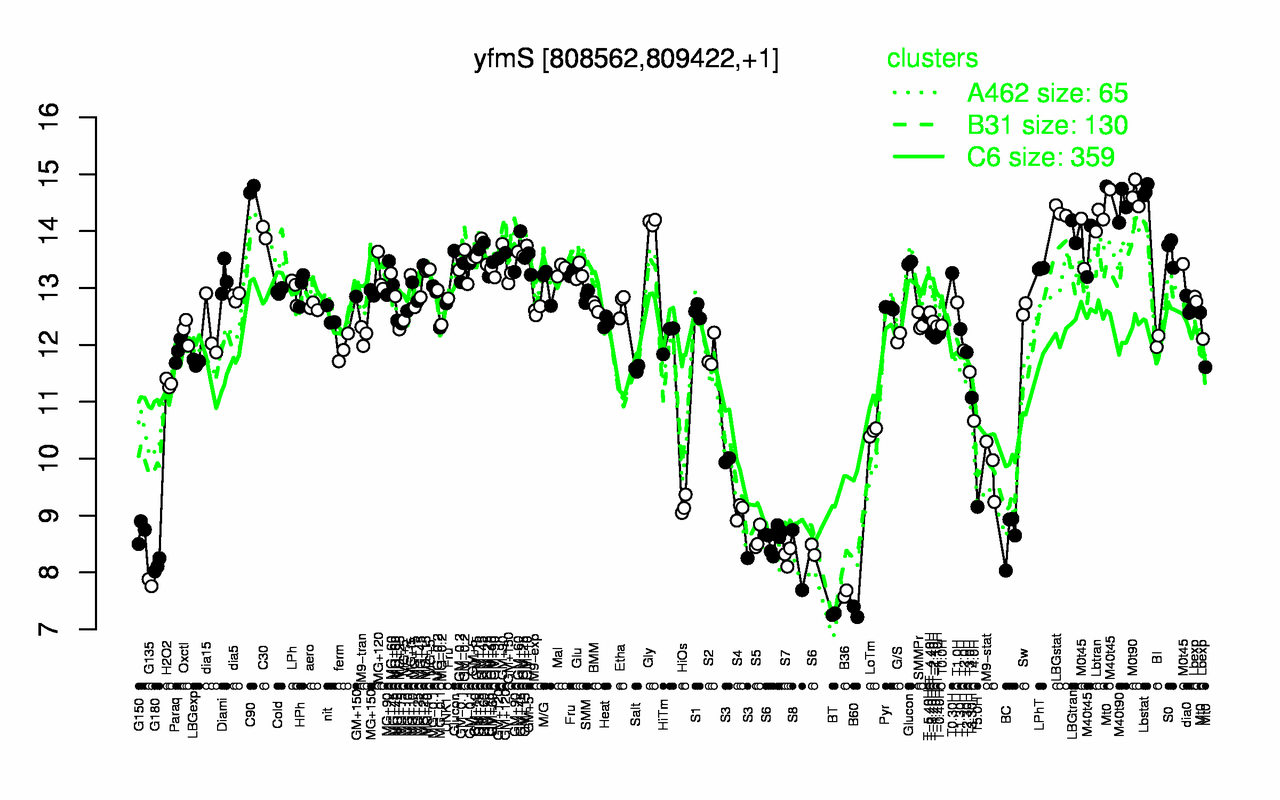
| C90 | Lbstat | M0t90 | M40t90 | LBGstat | Lbtran | Gly | M40t45 | LBGtran | C30 |
| 14.7 | 14.7 | 14.6 | 14.4 | 14.3 | 14.2 | 14.2 | 14 | 14 | 14 |
| BT | B60 | B36 | G135 | G180 | S8 | S7 | S6 | S5 | BC |
| 7.27 | 7.31 | 7.63 | 7.82 | 8.12 | 8.22 | 8.28 | 8.55 | 8.6 | 8.64 |