B. subtilis Expression Data Browser
Start Page
B. subtilis Expression Data Browser
Gene/Segment:
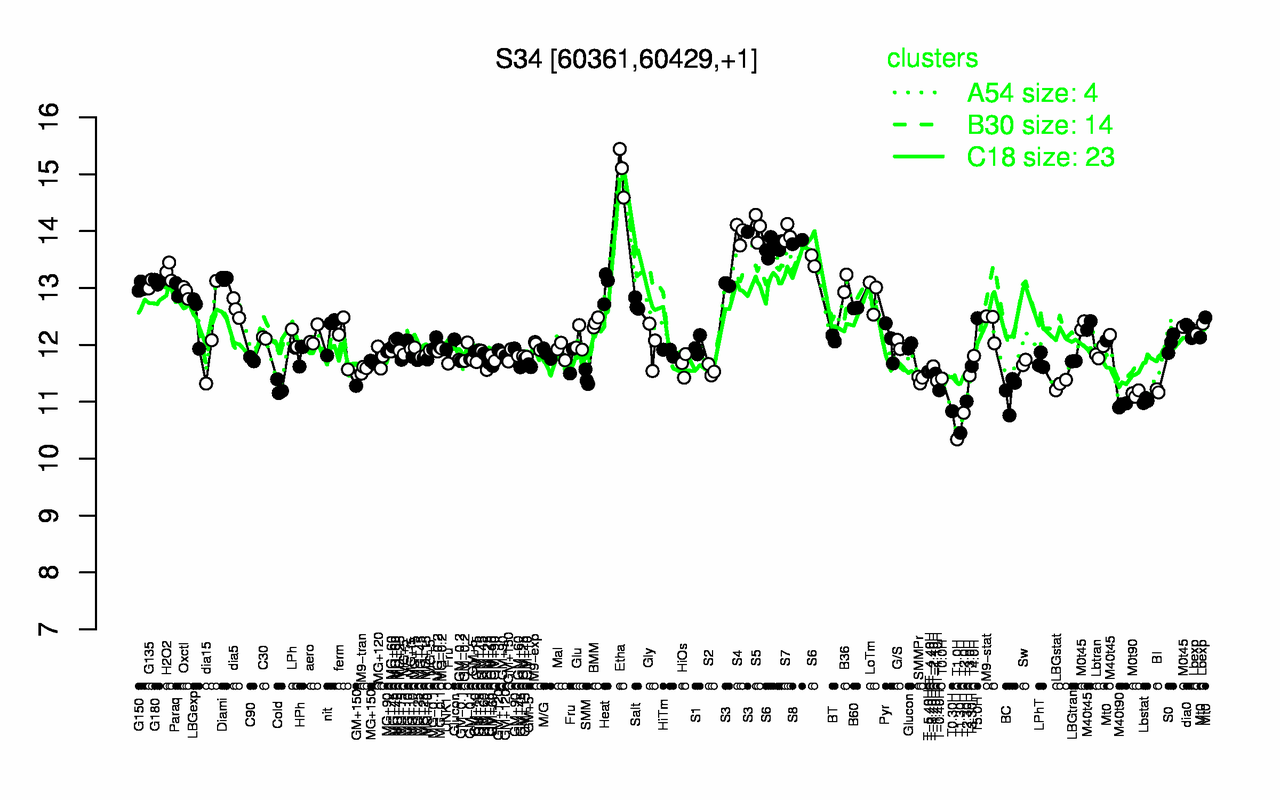
S34
Locus Tag:
new_60361_60429
Details about S34
Show/Hide
Highest Expression Conditions
Etha
S5
S4
S7
S8
S6
S3
H2O2
Diami
G180
15
14.1
14
13.9
13.8
13.7
13.4
13.3
13.2
13.1
Lowest Expression Conditions
T1.0H
T1.30H
T2.0H
T0.30H
M40t90
T2.30H
Lbstat
M0t90
BC
BI
10.3
10.5
10.8
10.8
10.9
11
11
11.1
11.2
11.2
Most Positively Correlated Segments
yabK
pth
S35
spoVT
mfd
S1065
S1064
yphA
seaA
S1050
0.96
0.93
0.86
0.85
0.85
0.79
0.79
0.78
0.78
0.78
Most Negatively Correlated Segments
S788
yopD
yopI
yopF
yopG
yopH
ymzD
yopJ
yokG
S613
-0.78
-0.74
-0.74
-0.73
-0.73
-0.73
-0.72
-0.72
-0.72
-0.71
Expression Profile of Segment S34
Show/Hide
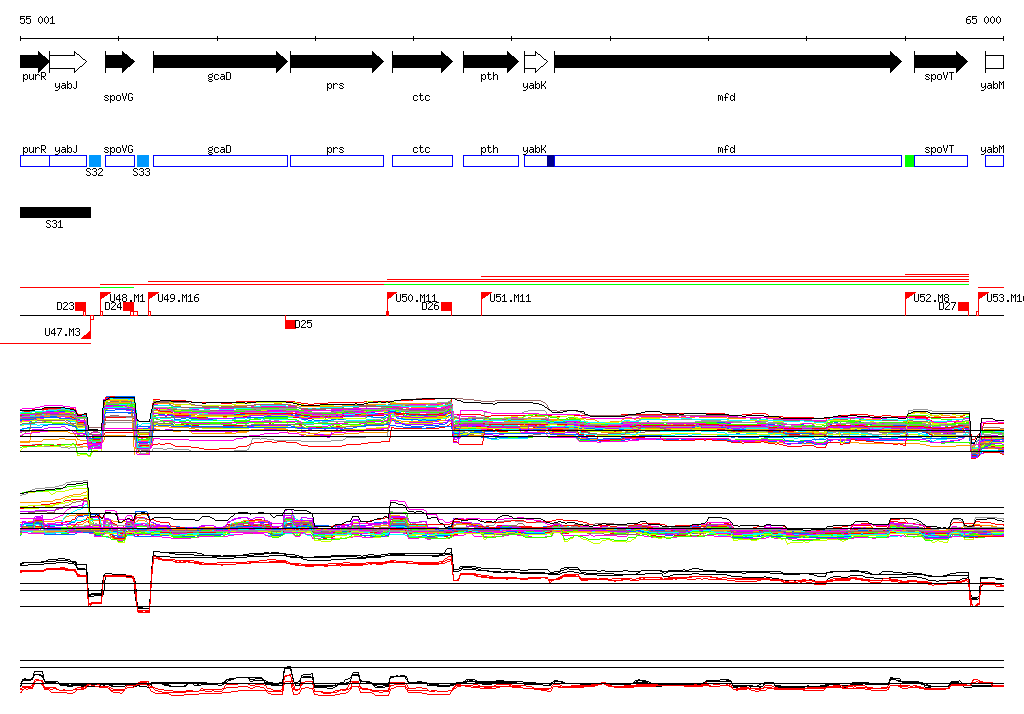
Genomic View of Gene/Segment S34
Show/Hide
(Legend)
Browse Genome Context