| Start Page |
|
 |
| Start Page |
|
|
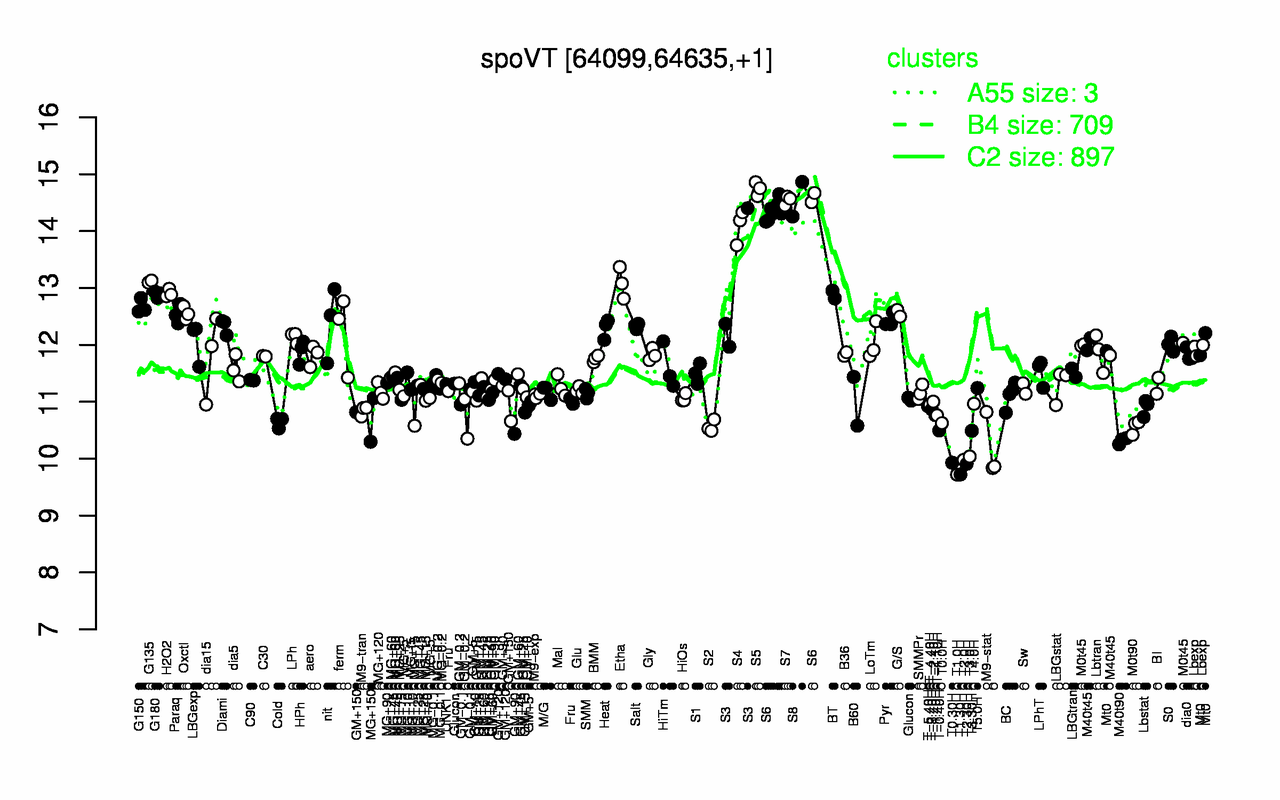
| S5 | S8 | S7 | S6 | S4 | G135 | Etha | S3 | H2O2 | G180 |
| 14.7 | 14.6 | 14.5 | 14.4 | 14.1 | 13.1 | 13.1 | 12.9 | 12.9 | 12.9 |
| T1.0H | T1.30H | T2.30H | T0.30H | T2.0H | T3.0H | M9-stat | M40t90 | T3.30H | T-0.40H |
| 9.72 | 9.72 | 9.91 | 9.93 | 9.98 | 10 | 10.2 | 10.3 | 10.5 | 10.5 |