B. subtilis Expression Data Browser
Start Page
B. subtilis Expression Data Browser
Gene/Segment:
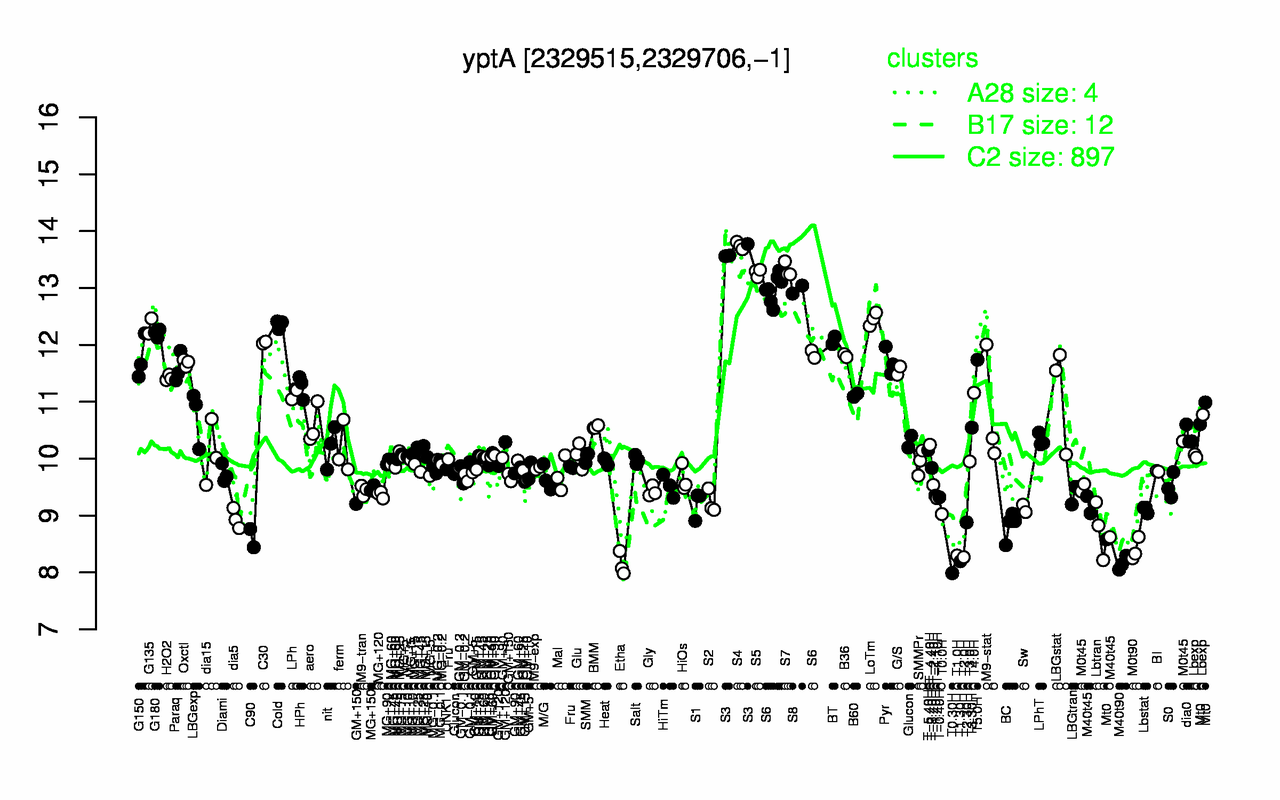
yptA
Locus Tag:
BSU22160
Details about yptA
Show/Hide
Highest Expression Conditions
S4
S3
S7
S5
S8
S6
LoTm
Cold
G135
G180
13.7
13.6
13.3
13.3
13
12.7
12.5
12.4
12.3
12.2
Lowest Expression Conditions
T0.30H
Etha
M40t90
T1.30H
T2.0H
T1.0H
M0t90
C90
Lbtran
BC
7.99
8.14
8.16
8.2
8.27
8.3
8.4
8.6
8.76
8.83
Most Positively Correlated Segments
S837
S662
bofA
ypuI
yugT
S518
stoA
ycgG
yhbB
cypA
0.97
0.9
0.86
0.86
0.84
0.84
0.84
0.83
0.83
0.83
Most Negatively Correlated Segments
pksB
ypjP
ydbB
ylaL
pepT
yceE
yceD
yceH
ypfD
yhfE
-0.78
-0.75
-0.75
-0.74
-0.74
-0.73
-0.73
-0.72
-0.72
-0.72
Expression Profile of Segment yptA
Show/Hide
Annotation of Gene yptA
Show/Hide
inference
ab initio prediction:AMIGene:2.0
codon_start
1
product
hypothetical protein
transl_table
11
note
Evidence 5: No homology to any previously reported sequences
db_xref
GI:2634635
protein_id
CAB14133.1
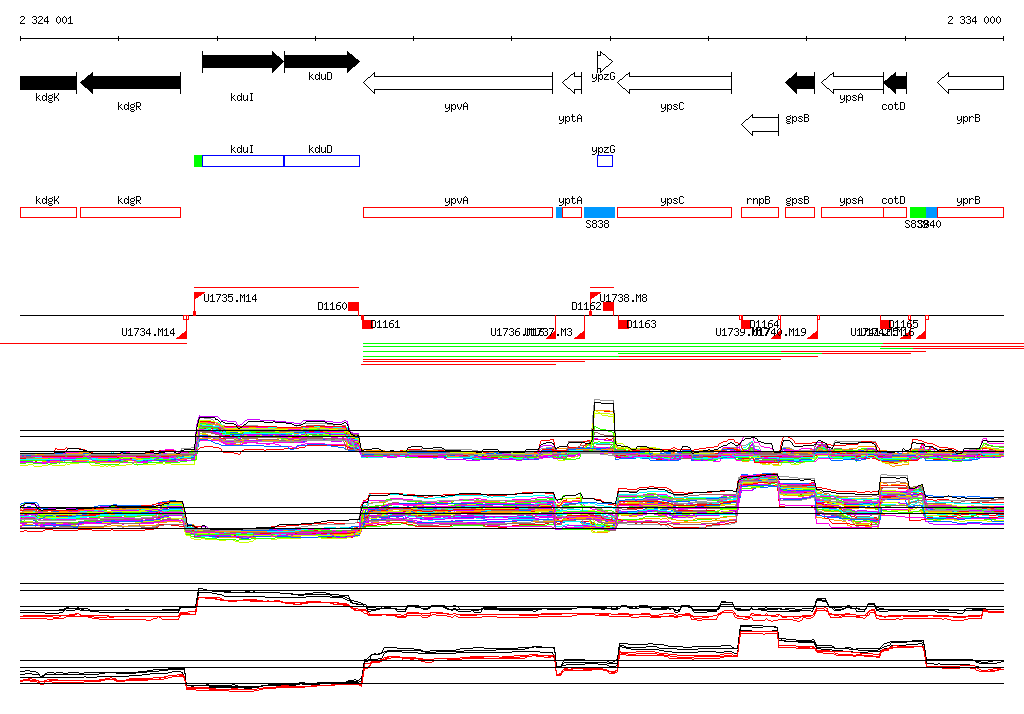
Genomic View of Gene/Segment yptA
Show/Hide
(Legend)
Browse Genome Context