B. subtilis Expression Data Browser
Start Page
B. subtilis Expression Data Browser
Gene/Segment:
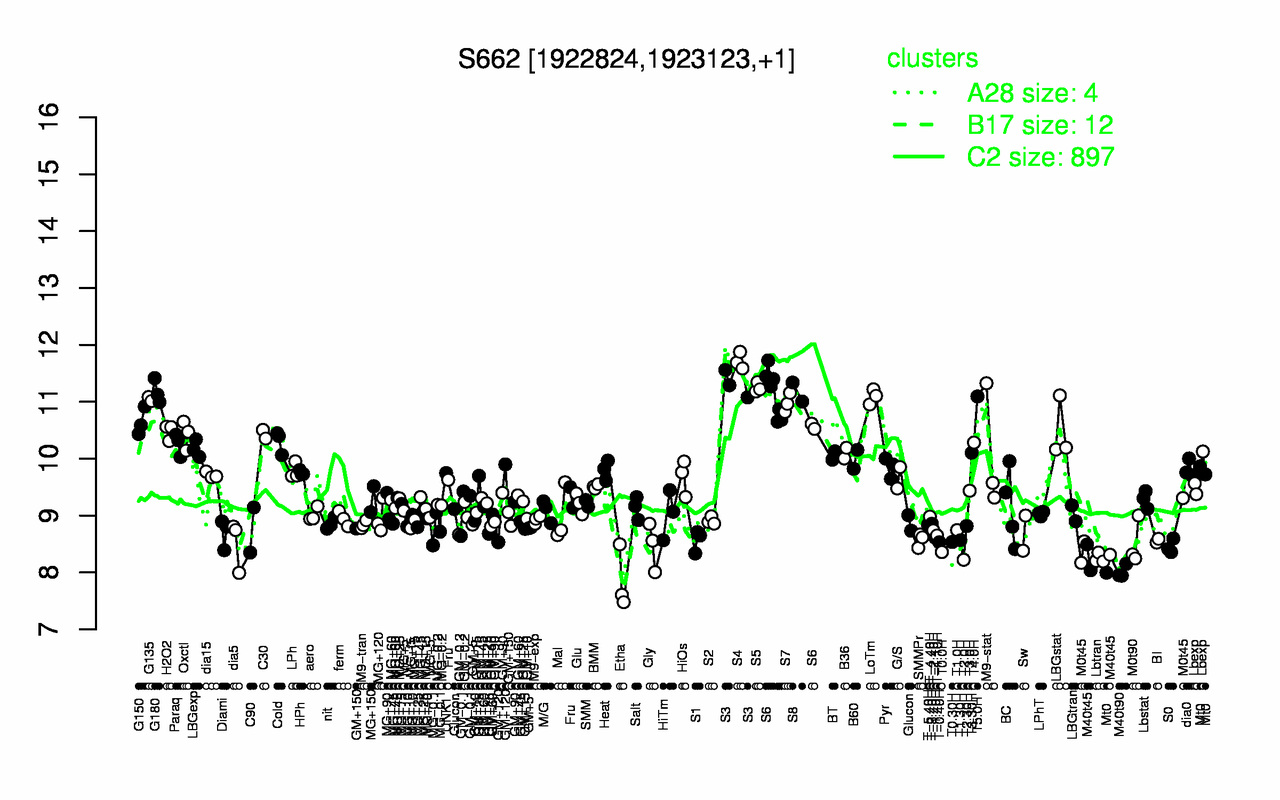
S662
Locus Tag:
new_1922824_1923123
Details about S662
Show/Hide
Highest Expression Conditions
S4
S3
S5
G180
S8
T5.0H
LoTm
G135
S6
S7
11.7
11.3
11.2
11.2
11.2
11.1
11.1
11
11
11
Lowest Expression Conditions
Etha
M40t90
T2.0H
Lbtran
M40t45
T0.0H
S0
Gly
dia5
M0t90
7.86
8.02
8.22
8.25
8.28
8.36
8.46
8.47
8.51
8.52
Most Positively Correlated Segments
yptA
S837
bofA
ypuI
ytxC
spoIVFB
S667
yugT
spoIVFA
stoA
0.9
0.89
0.85
0.82
0.82
0.8
0.8
0.8
0.79
0.79
Most Negatively Correlated Segments
yydB
pksB
pepT
ydbB
ybeC
ydbC
yceE
yydC
yfmT
yceH
-0.71
-0.7
-0.7
-0.7
-0.69
-0.69
-0.68
-0.68
-0.68
-0.68
Expression Profile of Segment S662
Show/Hide
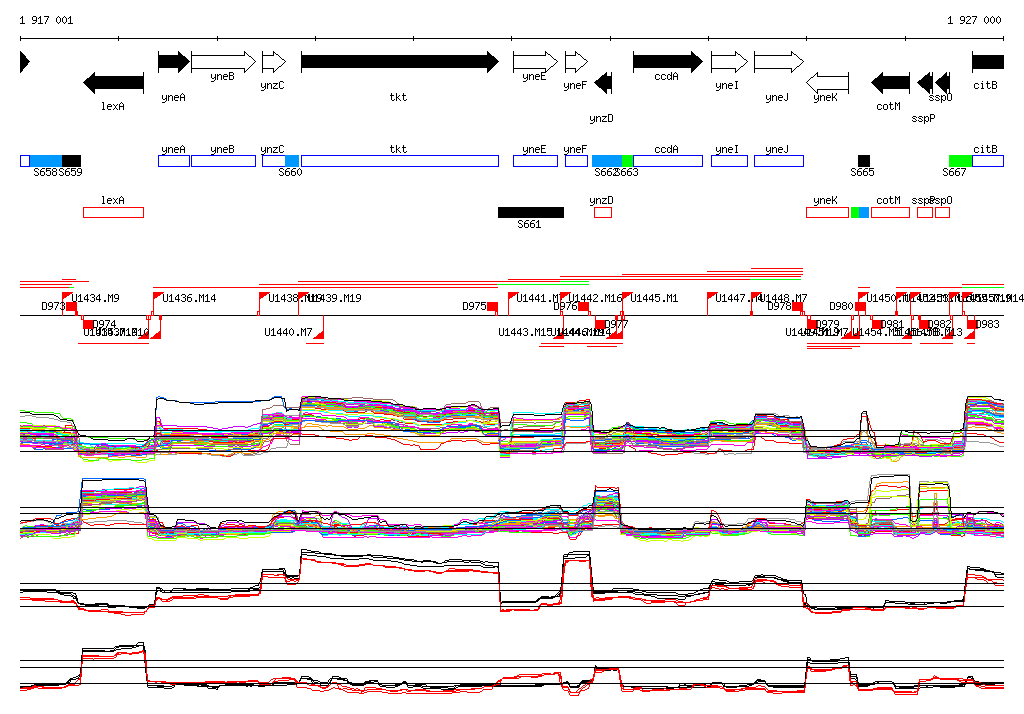
Genomic View of Gene/Segment S662
Show/Hide
(Legend)
Browse Genome Context