| Start Page |
|
 |
| Start Page |
|
|
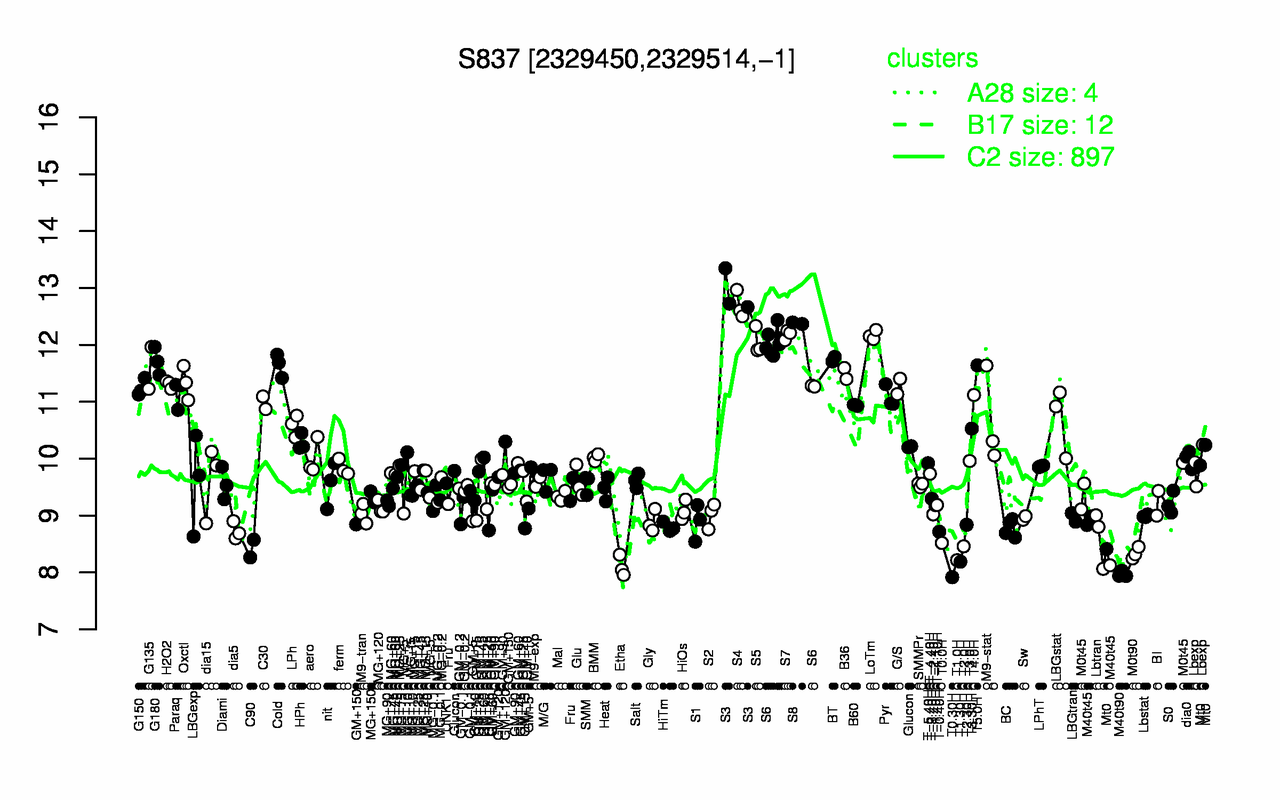
| S3 | S4 | S8 | S7 | LoTm | S5 | S6 | BT | G180 | Cold |
| 12.9 | 12.7 | 12.4 | 12.2 | 12.2 | 12.1 | 11.9 | 11.7 | 11.7 | 11.6 |
| T0.30H | M40t90 | Etha | T1.30H | T1.0H | M0t90 | C90 | T2.0H | T0.0H | Lbtran |
| 7.92 | 7.97 | 8.1 | 8.19 | 8.22 | 8.34 | 8.42 | 8.46 | 8.52 | 8.62 |