| Start Page |
|
 |
| Start Page |
|
|
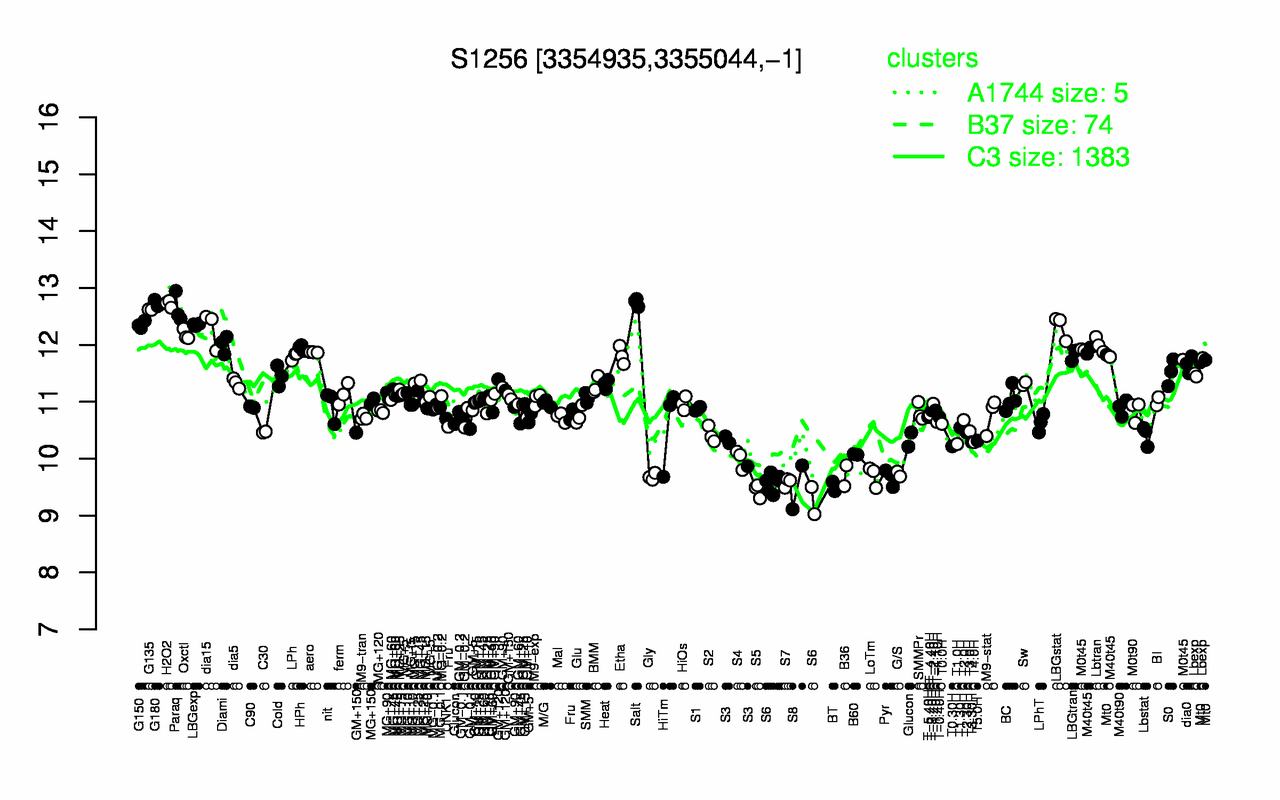
| Salt | G180 | H2O2 | Paraq | G135 | G150 | LBGexp | LBGstat | dia15 | Oxctl |
| 12.7 | 12.7 | 12.7 | 12.6 | 12.6 | 12.4 | 12.4 | 12.3 | 12.3 | 12.2 |
| S5 | S8 | S6 | BT | S7 | Pyr | Gly | LoTm | B36 | G/S |
| 9.44 | 9.5 | 9.51 | 9.51 | 9.58 | 9.67 | 9.68 | 9.7 | 9.7 | 9.73 |