B. subtilis Expression Data Browser
Start Page
B. subtilis Expression Data Browser
Gene/Segment:
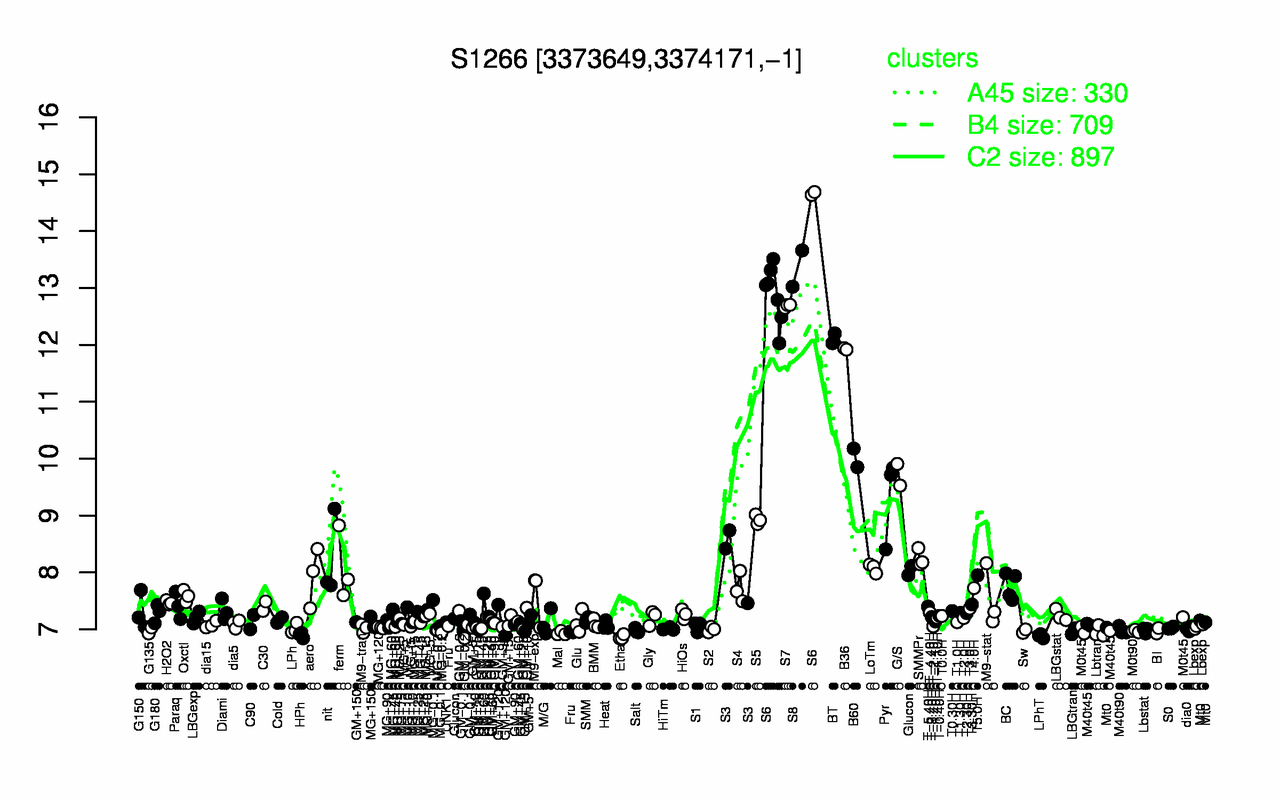
S1266
Locus Tag:
new_3373649_3374171_c
Details about S1266
Show/Hide
Highest Expression Conditions
S8
S6
S7
BT
B36
B60
G/S
Pyr
S5
SMMPr
13.3
13.3
12.7
12.1
11.9
10
9.72
9.32
8.93
8.25
Lowest Expression Conditions
Etha
LPhT
HPh
Mal
MG-0.2
Lbtran
LBGtran
Sw
M0t90
BI
6.87
6.88
6.9
6.93
6.96
6.96
6.97
6.97
6.97
6.98
Most Positively Correlated Segments
S1264
fadM
yodH
S841
cotP
S842
S195
yqfQ
gerT
S872
0.99
0.98
0.96
0.96
0.96
0.96
0.96
0.96
0.96
0.95
Most Negatively Correlated Segments
parA
ykuH
S511
ptkA
S1189
yulF
yusH
ezrA
addA
penP
-0.84
-0.84
-0.83
-0.82
-0.82
-0.82
-0.81
-0.81
-0.81
-0.81
Expression Profile of Segment S1266
Show/Hide
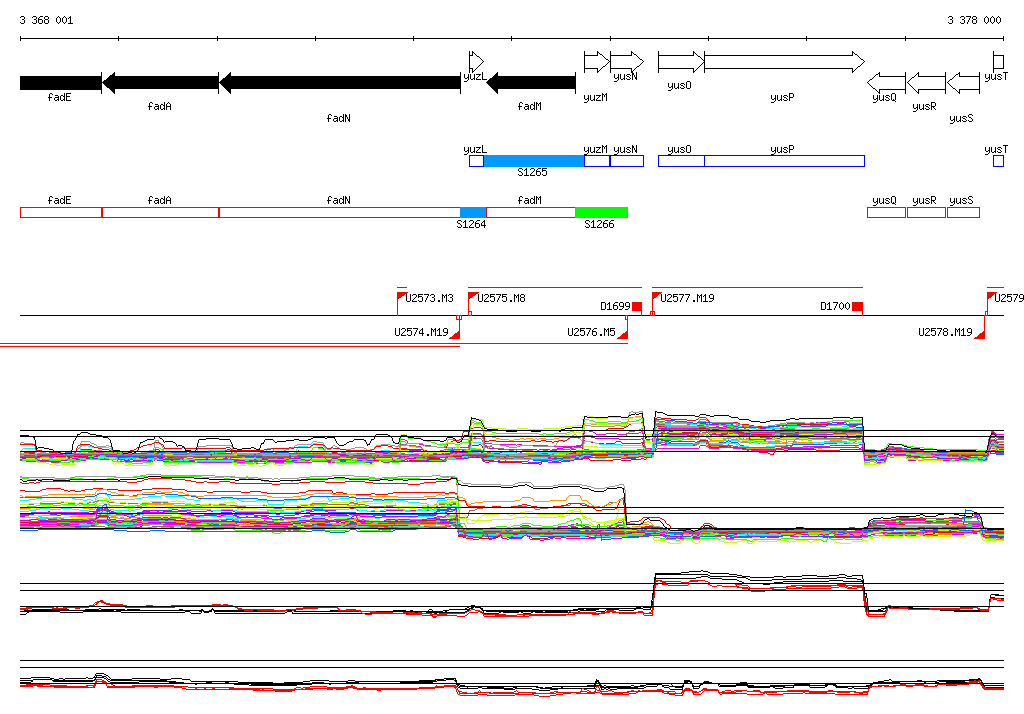
Genomic View of Gene/Segment S1266
Show/Hide
(Legend)
Browse Genome Context