| Start Page |
|
 |
| Start Page |
|
|
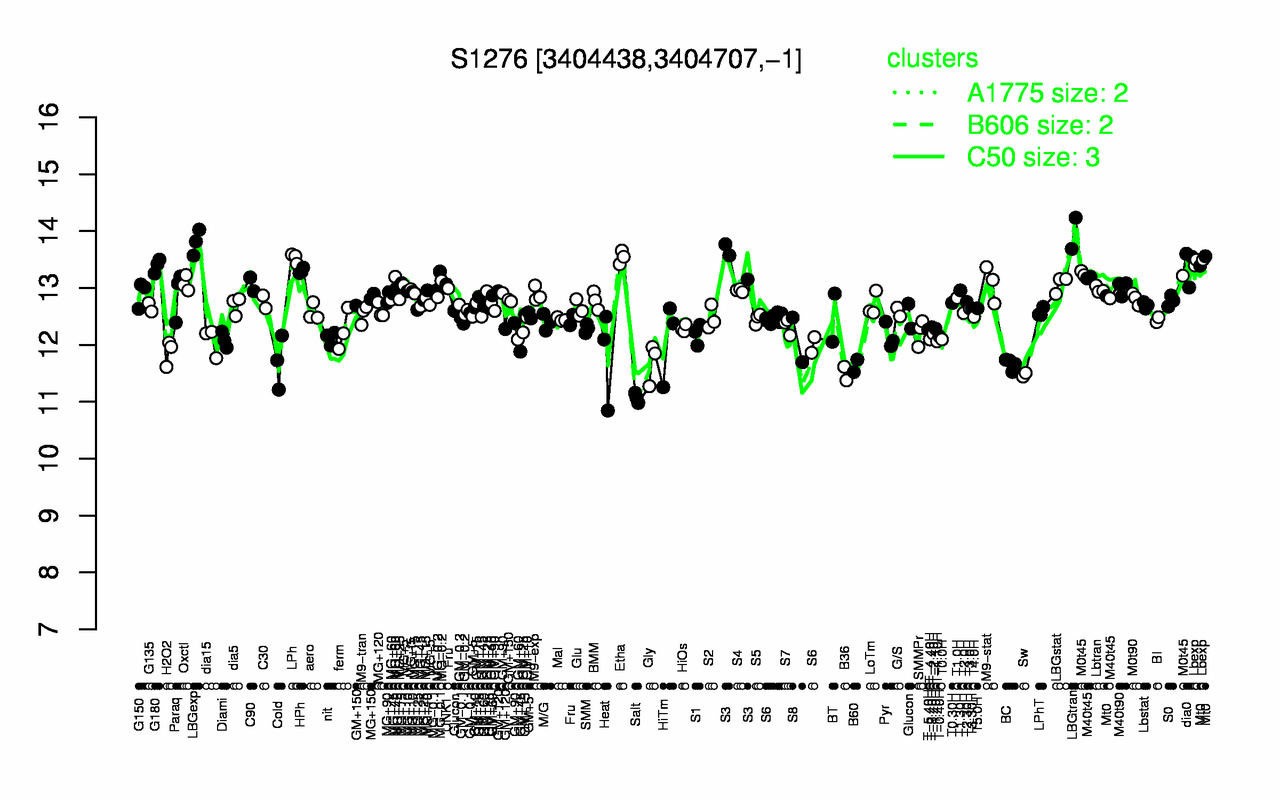
| LBGtran | LBGexp | Etha | LPh | S3 | Lbexp | G180 | dia0 | HPh | Mt0 |
| 14 | 13.8 | 13.5 | 13.5 | 13.5 | 13.5 | 13.4 | 13.4 | 13.3 | 13.3 |
| Salt | Sw | B36 | B60 | BC | Gly | Cold | Heat | H2O2 | T-1.10H |
| 11.1 | 11.5 | 11.5 | 11.6 | 11.7 | 11.7 | 11.7 | 11.8 | 11.9 | 12.1 |