| Start Page |
|
 |
| Start Page |
|
|
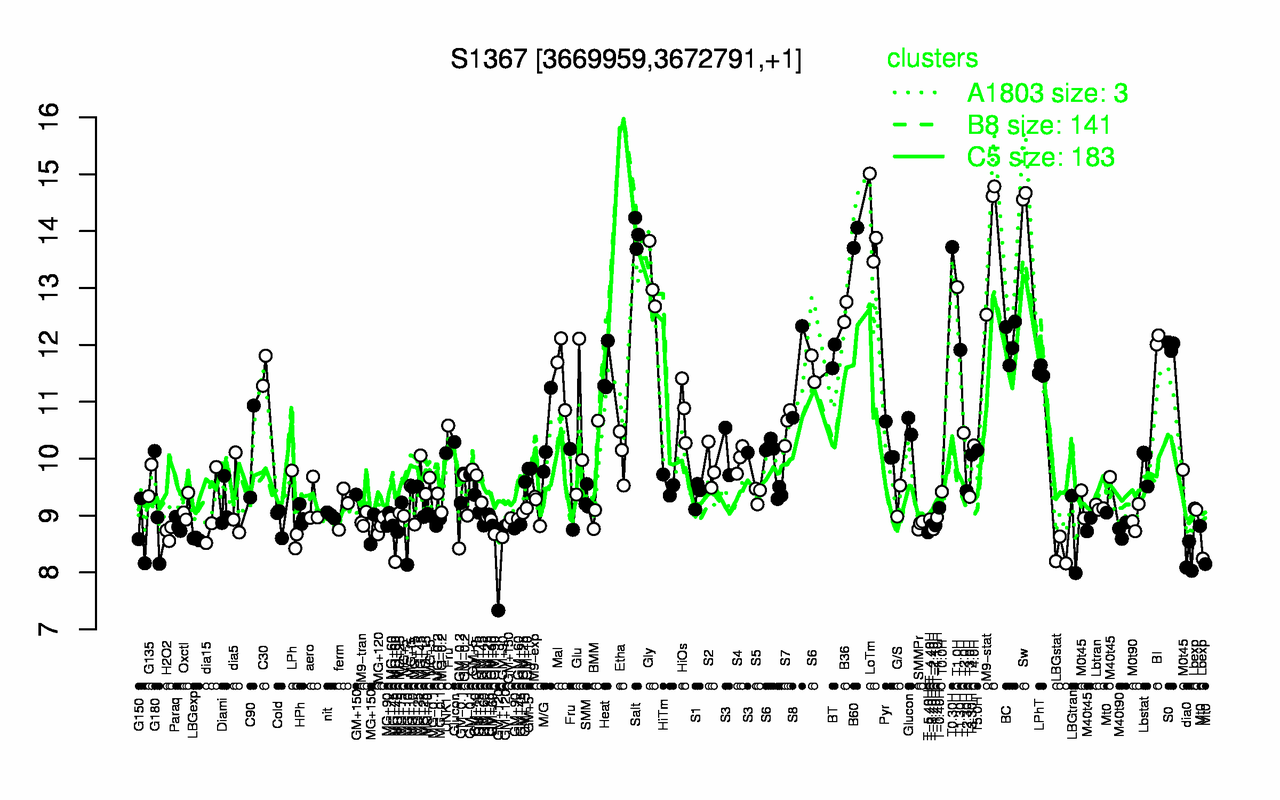
| Sw | LoTm | M9-stat | Salt | B60 | T0.30H | Gly | T1.0H | B36 | BI |
| 14.6 | 14.1 | 14 | 14 | 13.9 | 13.7 | 13.2 | 13 | 12.6 | 12.1 |
| GM+120 | dia0 | LBGstat | MG+60 | LBGexp | LBGtran | Mt0 | G150 | GM+90 | H2O2 |
| 8.07 | 8.22 | 8.33 | 8.57 | 8.59 | 8.67 | 8.67 | 8.68 | 8.69 | 8.7 |