| Start Page |
|
 |
| Start Page |
|
|
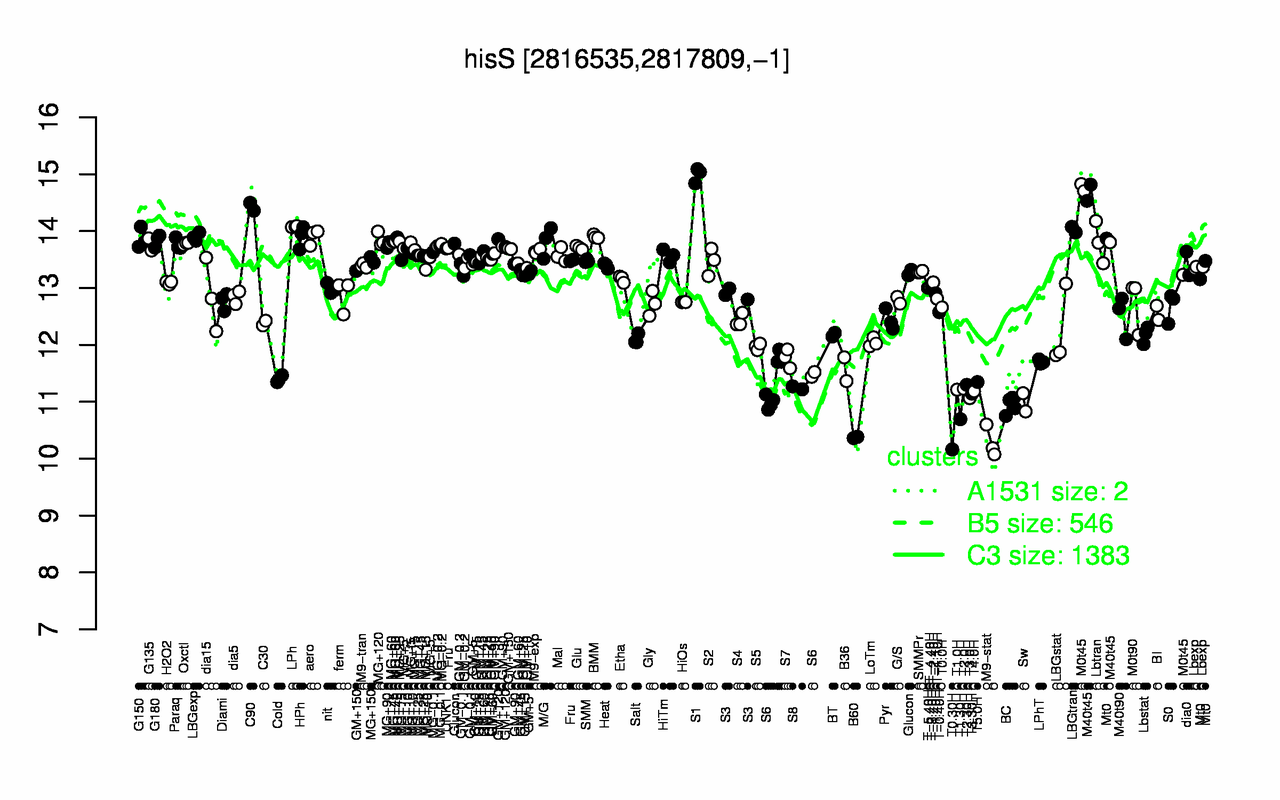
| S1 | C90 | M40t45 | M0t45 | LPh | LBGtran | BMM | aero | HPh | LBGexp |
| 15 | 14.4 | 14.4 | 14.3 | 14.1 | 14 | 13.9 | 13.9 | 13.9 | 13.9 |
| T0.30H | M9-stat | B60 | T1.30H | BC | Sw | T3.0H | T3.30H | T4.0H | T1.0H |
| 10.2 | 10.3 | 10.4 | 10.7 | 10.9 | 11 | 11.1 | 11.1 | 11.2 | 11.2 |