| Start Page |
|
 |
| Start Page |
|
|
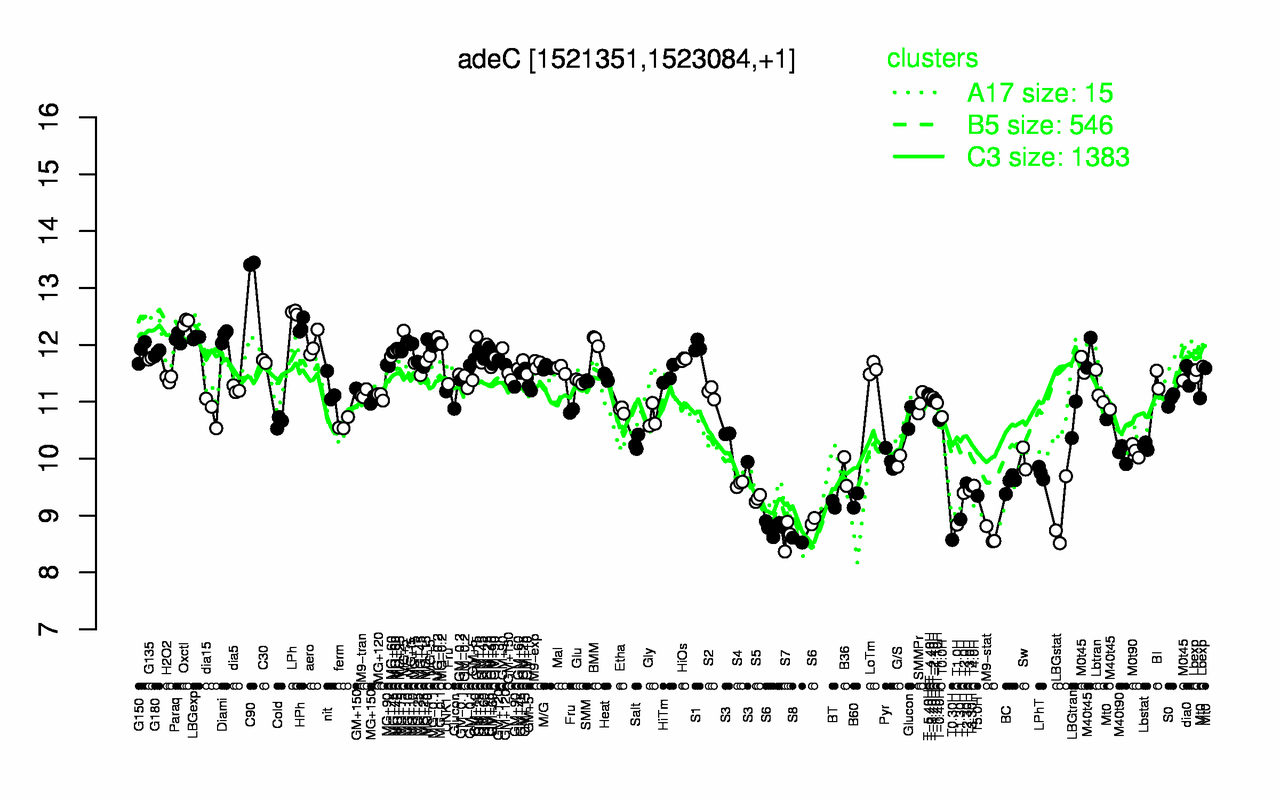
| C90 | LPh | Oxctl | HPh | Diami | LBGexp | Paraq | BMM | MG-0.2 | MG+10 |
| 13.4 | 12.6 | 12.4 | 12.3 | 12.2 | 12.1 | 12.1 | 12.1 | 12.1 | 12.1 |
| S8 | T0.30H | M9-stat | S7 | S6 | T1.0H | T1.30H | LBGstat | BT | B60 |
| 8.57 | 8.57 | 8.64 | 8.64 | 8.83 | 8.84 | 8.93 | 8.98 | 9.2 | 9.27 |