| Start Page |
|
 |
| Start Page |
|
|
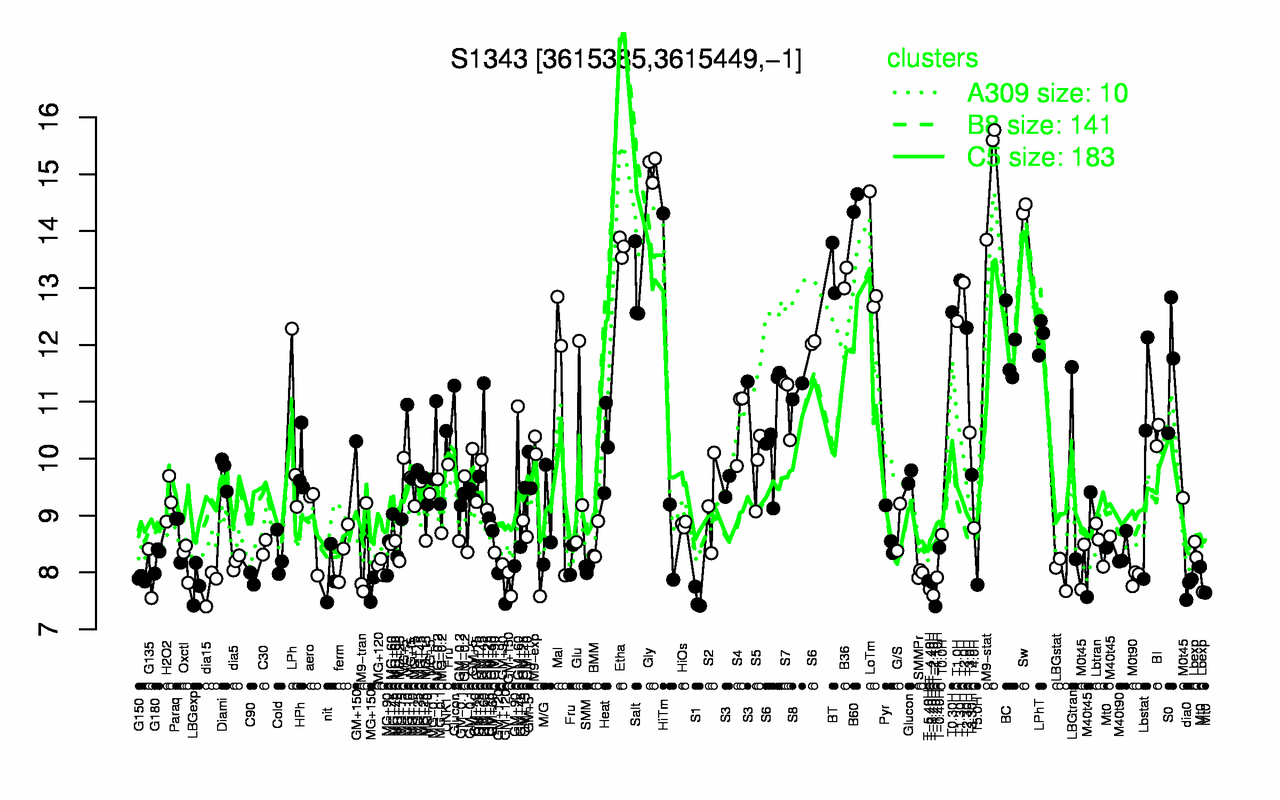
| Gly | M9-stat | B60 | Sw | Etha | LoTm | BT | B36 | T1.30H | T2.0H |
| 15.1 | 15.1 | 14.5 | 14.4 | 13.7 | 13.4 | 13.4 | 13.2 | 13.1 | 13.1 |
| T-1.40H | S1 | T-2.40H | MG+150 | T-4.40H | GM+120 | dia0 | dia15 | T5.0H | LBGexp |
| 7.4 | 7.53 | 7.6 | 7.7 | 7.71 | 7.72 | 7.74 | 7.76 | 7.78 | 7.78 |