| Start Page |
|
 |
| Start Page |
|
|
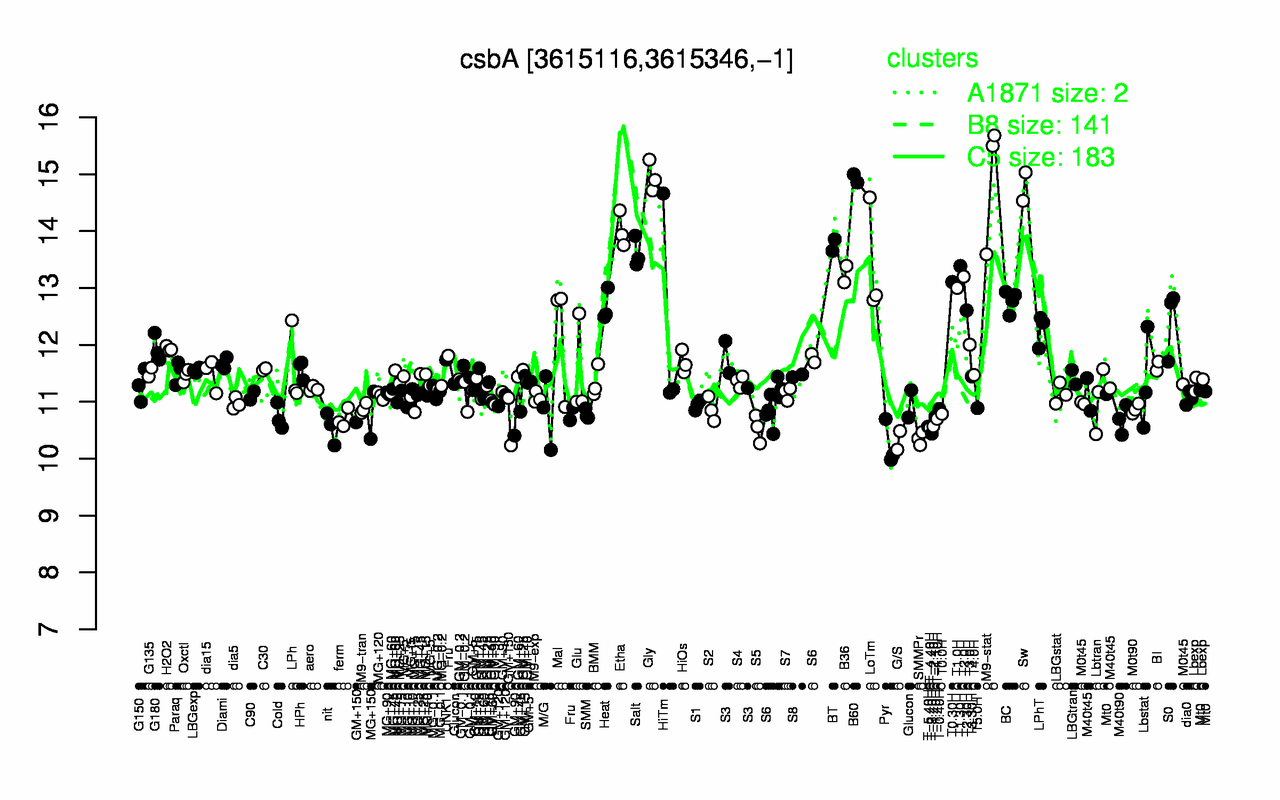
| Gly | B60 | M9-stat | Sw | Etha | BT | Salt | LoTm | T1.30H | B36 |
| 15 | 14.9 | 14.9 | 14.8 | 14 | 13.8 | 13.6 | 13.4 | 13.4 | 13.2 |
| Pyr | G/S | SMMPr | T-3.40H | S5 | T-4.40H | nit | T-5.40H | T-2.40H | GM+150 |
| 10.2 | 10.3 | 10.4 | 10.4 | 10.5 | 10.5 | 10.5 | 10.6 | 10.6 | 10.6 |