B. subtilis Expression Data Browser
Start Page
B. subtilis Expression Data Browser
Gene/Segment:
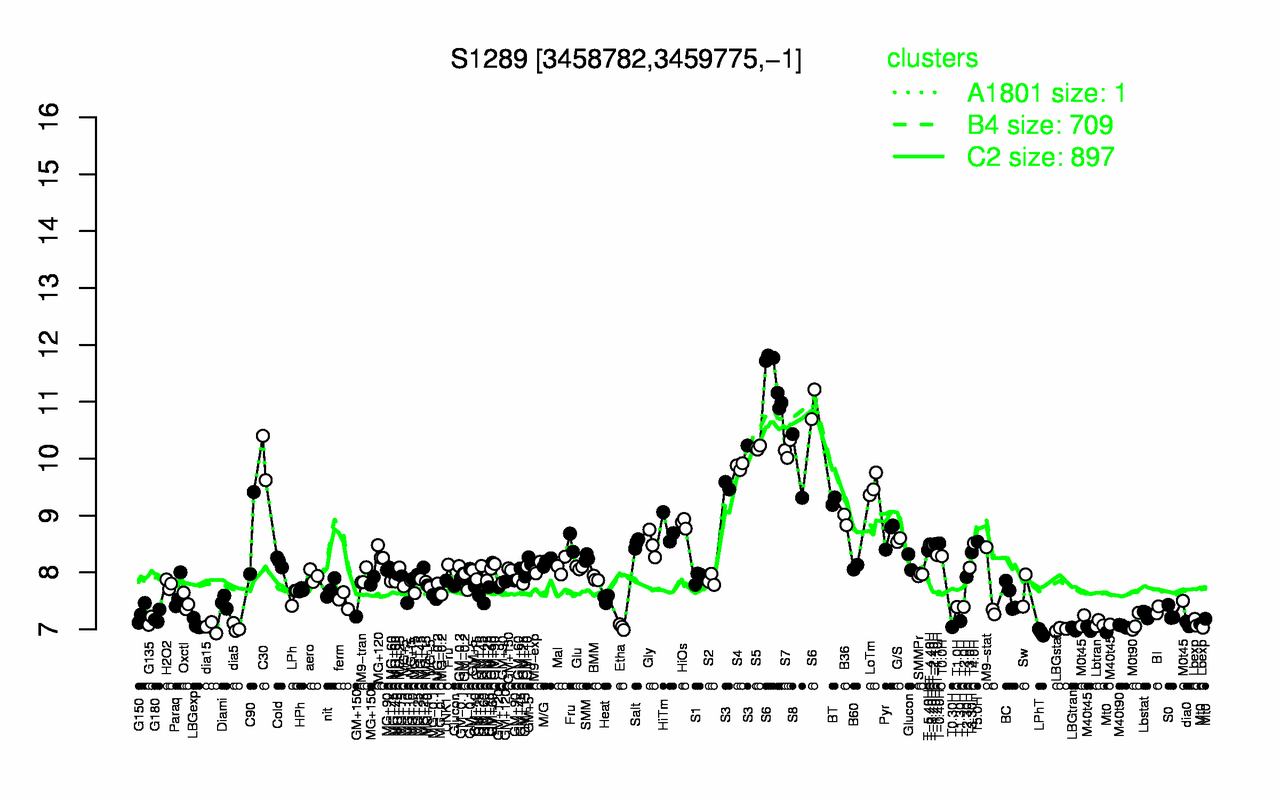
S1289
Locus Tag:
new_3458782_3459775_c
Details about S1289
Show/Hide
Highest Expression Conditions
S6
S5
S7
C30
S8
S4
S3
LoTm
BT
B36
11.3
10.2
10.2
10
9.87
9.87
9.76
9.53
9.25
8.92
Lowest Expression Conditions
LPhT
LBGstat
LBGtran
dia5
dia15
M40t45
T0.30H
Etha
M40t90
Mt0
6.95
7
7
7.03
7.03
7.04
7.04
7.04
7.06
7.08
Most Positively Correlated Segments
yhfW
S1550
S745
yutG
S166
yozP
S803
S265
yhjR
kapD
0.83
0.82
0.82
0.82
0.82
0.82
0.82
0.82
0.82
0.82
Most Negatively Correlated Segments
yfmR
yddK
yybA
kinC
addB
moaE
lrpC
mobB
moeB
prsA
-0.85
-0.83
-0.82
-0.82
-0.81
-0.81
-0.81
-0.8
-0.8
-0.8
Expression Profile of Segment S1289
Show/Hide
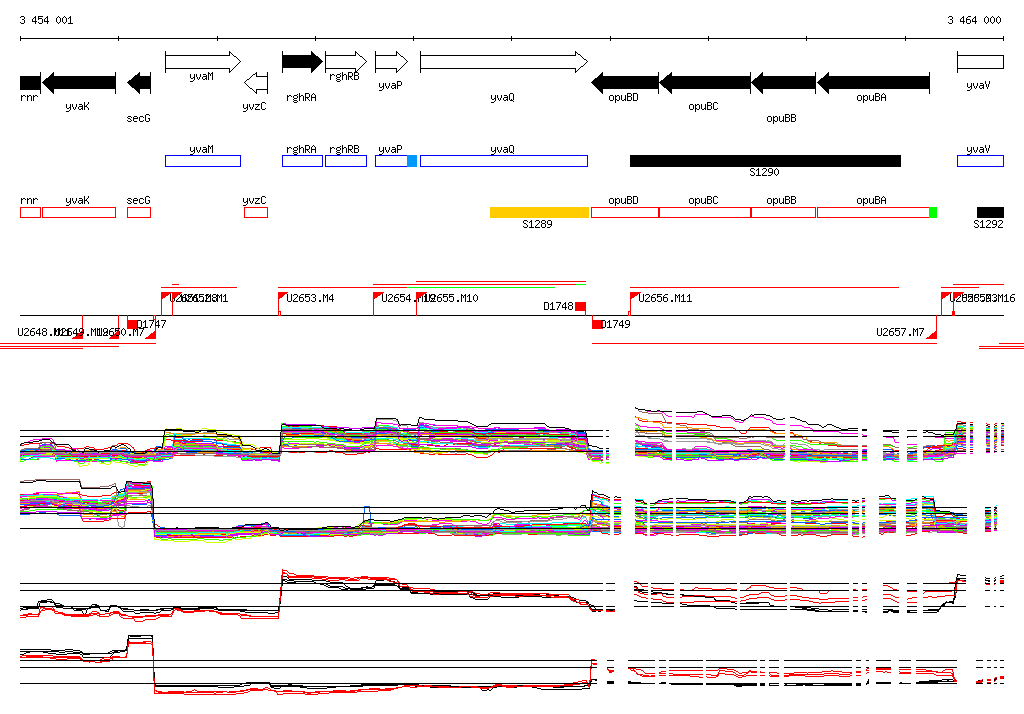
Genomic View of Gene/Segment S1289
Show/Hide
(Legend)
Browse Genome Context