| Start Page |
|
 |
| Start Page |
|
|
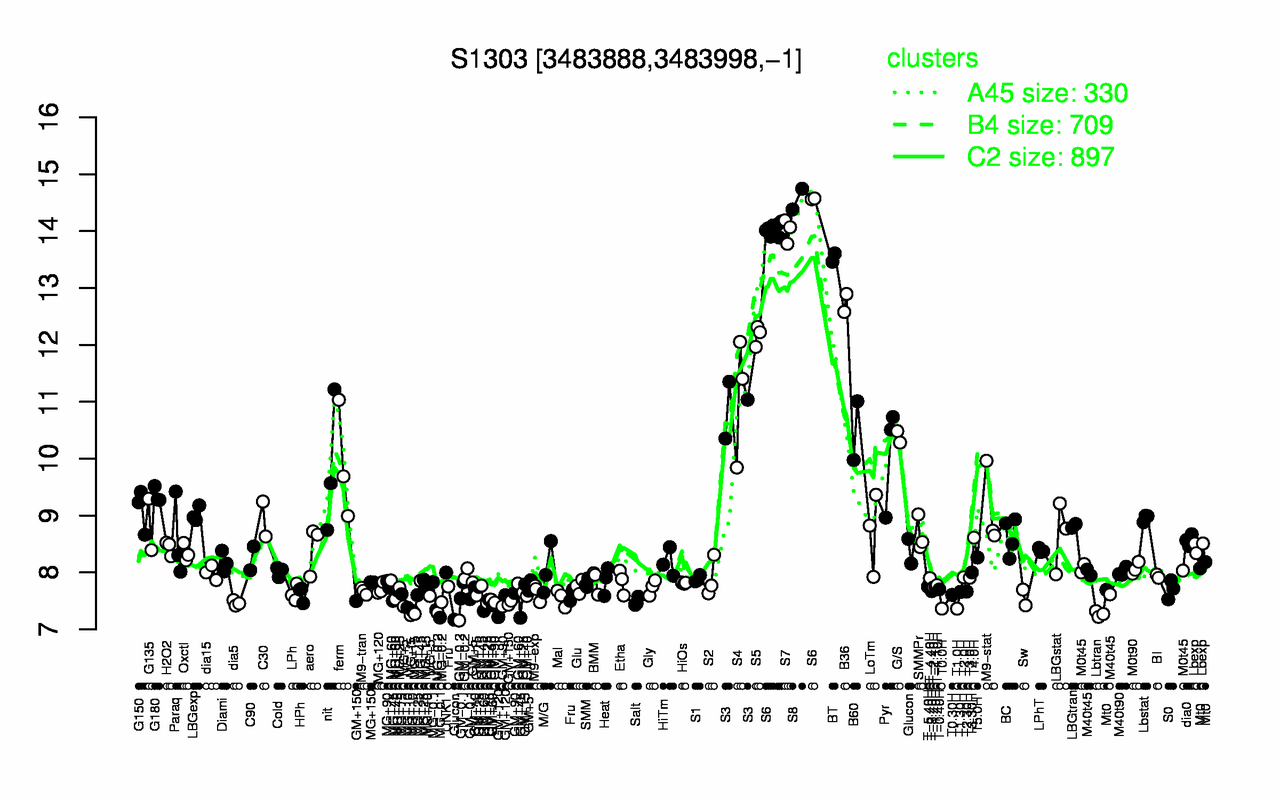
| S8 | S6 | S7 | BT | B36 | S5 | S4 | S3 | B60 | G/S |
| 14.6 | 14.2 | 14 | 13.5 | 12.7 | 12.2 | 11.1 | 10.9 | 10.5 | 10.4 |
| MG+t5 | Lbtran | T1.0H | T0.0H | MG-0.2 | GM+120 | MG-0.1 | dia5 | GM+150 | Salt |
| 7.25 | 7.27 | 7.36 | 7.36 | 7.38 | 7.41 | 7.46 | 7.46 | 7.48 | 7.49 |