| Start Page |
|
 |
| Start Page |
|
|
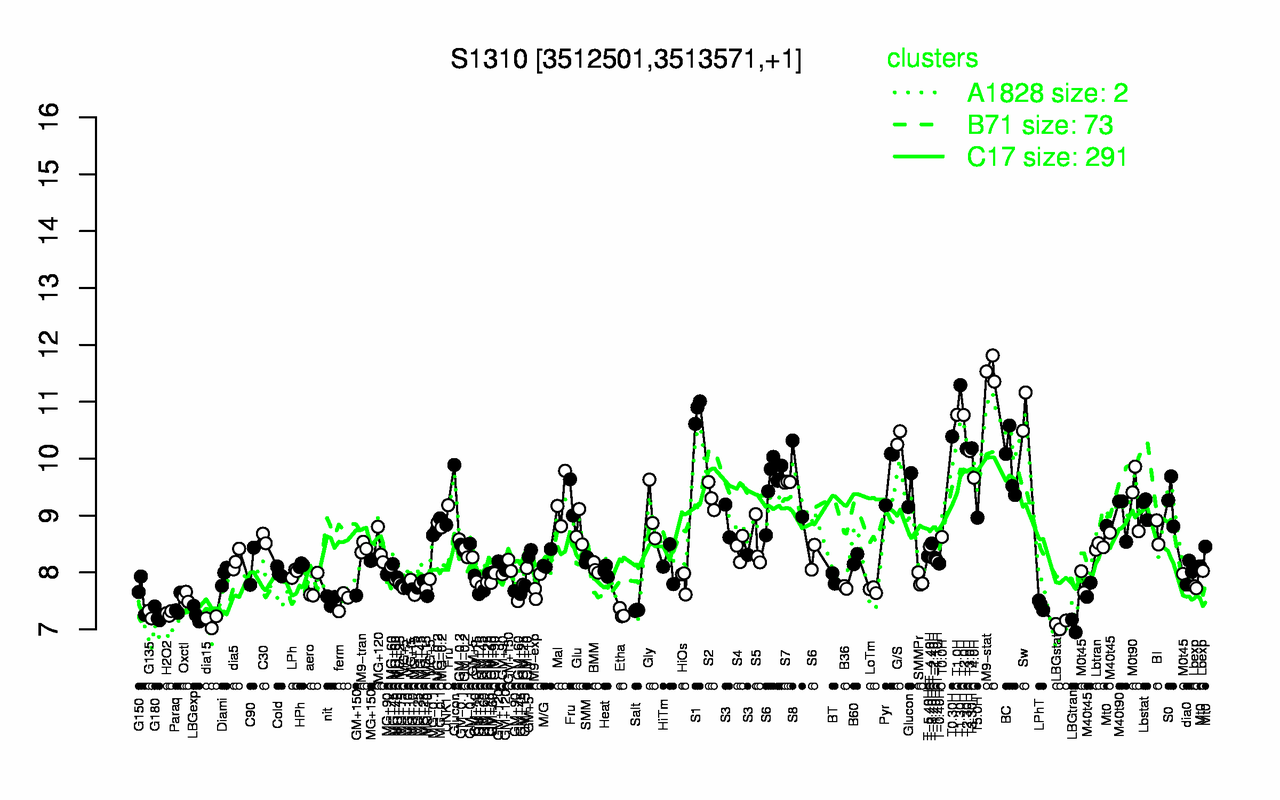
| M9-stat | T1.30H | S1 | Sw | T1.0H | T2.0H | T0.30H | G/S | T3.30H | T2.30H |
| 11.6 | 11.3 | 10.8 | 10.8 | 10.8 | 10.8 | 10.4 | 10.4 | 10.2 | 10.2 |
| LBGtran | LBGstat | dia15 | G180 | G135 | LBGexp | H2O2 | Etha | Salt | Paraq |
| 7.06 | 7.08 | 7.15 | 7.25 | 7.26 | 7.27 | 7.28 | 7.28 | 7.33 | 7.42 |