| Start Page |
|
 |
| Start Page |
|
|
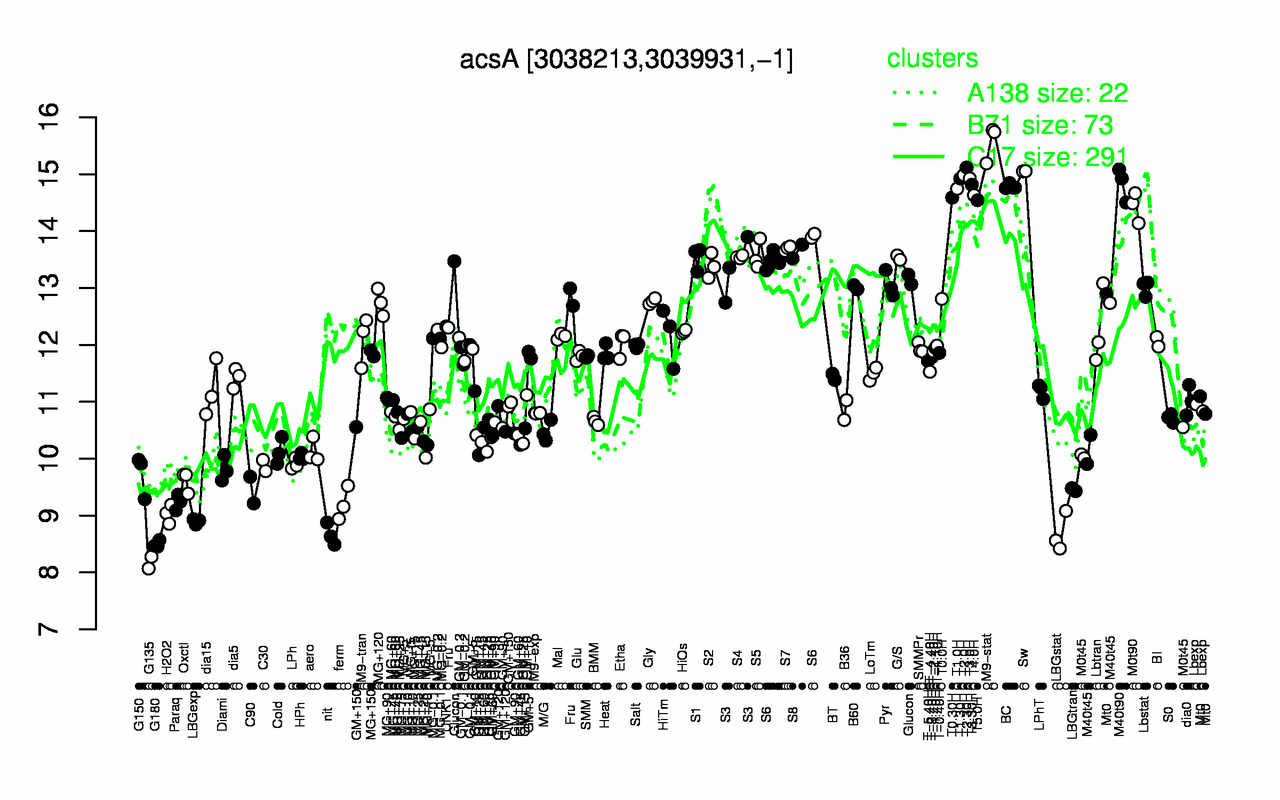
| M9-stat | T2.30H | Sw | T2.0H | T3.0H | T1.30H | M40t90 | T3.30H | BC | T1.0H |
| 15.6 | 15.1 | 15.1 | 15 | 14.9 | 14.9 | 14.8 | 14.8 | 14.8 | 14.7 |
| G135 | G180 | nit | LBGstat | LBGexp | H2O2 | ferm | Paraq | C90 | LBGtran |
| 8.17 | 8.5 | 8.67 | 8.69 | 8.9 | 9.03 | 9.21 | 9.23 | 9.45 | 9.45 |