| Start Page |
|
 |
| Start Page |
|
|
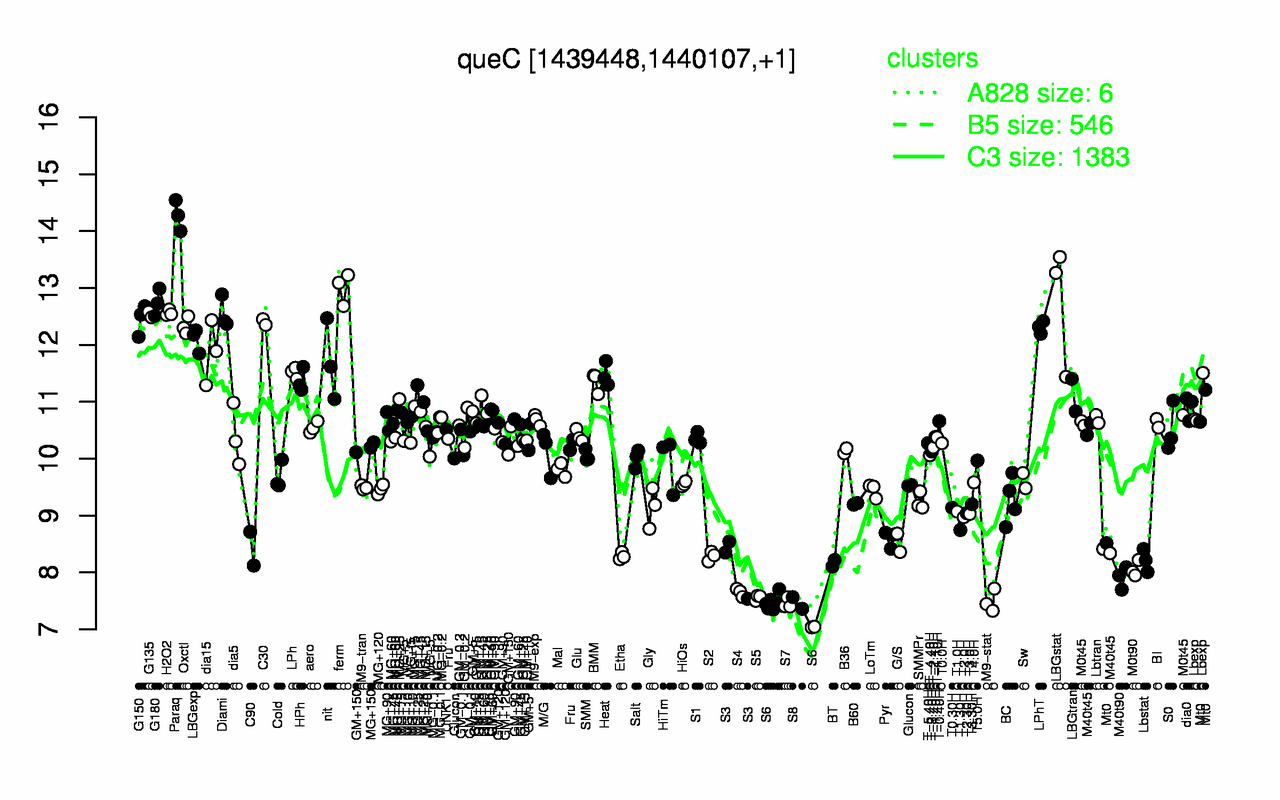
| Paraq | ferm | LBGstat | G180 | H2O2 | Diami | G135 | G150 | C30 | Oxctl |
| 14.3 | 13 | 12.7 | 12.7 | 12.6 | 12.6 | 12.5 | 12.5 | 12.4 | 12.3 |
| S6 | S7 | S8 | M9-stat | S5 | S4 | M40t90 | M0t90 | S3 | BT |
| 7.37 | 7.46 | 7.46 | 7.5 | 7.56 | 7.65 | 7.91 | 8.06 | 8.14 | 8.16 |