| Start Page |
|
 |
| Start Page |
|
|
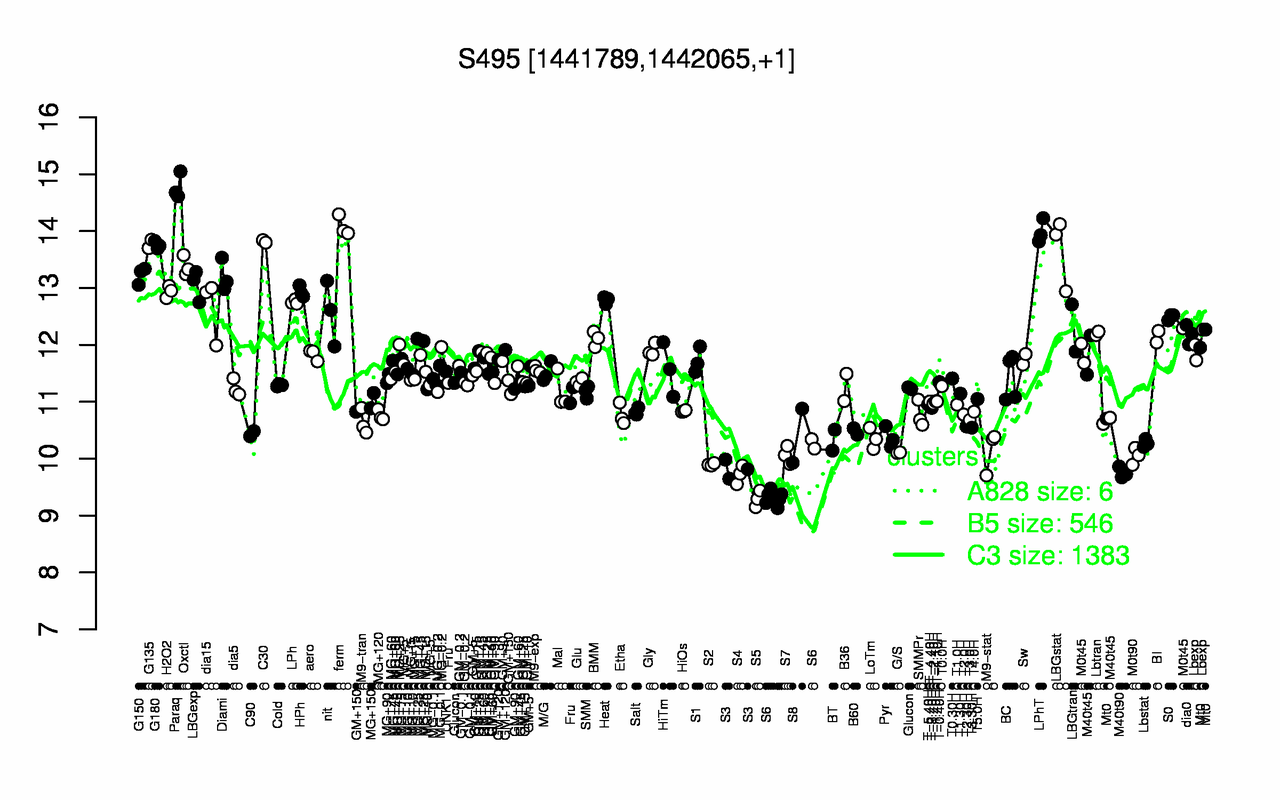
| Paraq | ferm | LPhT | C30 | G135 | G180 | LBGstat | Oxctl | G150 | Diami |
| 14.8 | 14.1 | 14 | 13.8 | 13.8 | 13.8 | 13.7 | 13.4 | 13.2 | 13.2 |
| S5 | S6 | S4 | M40t90 | S3 | S2 | M0t90 | S7 | G/S | M9-stat |
| 9.29 | 9.52 | 9.72 | 9.75 | 9.82 | 9.9 | 10 | 10.1 | 10.1 | 10.1 |