| Start Page |
|
 |
| Start Page |
|
|
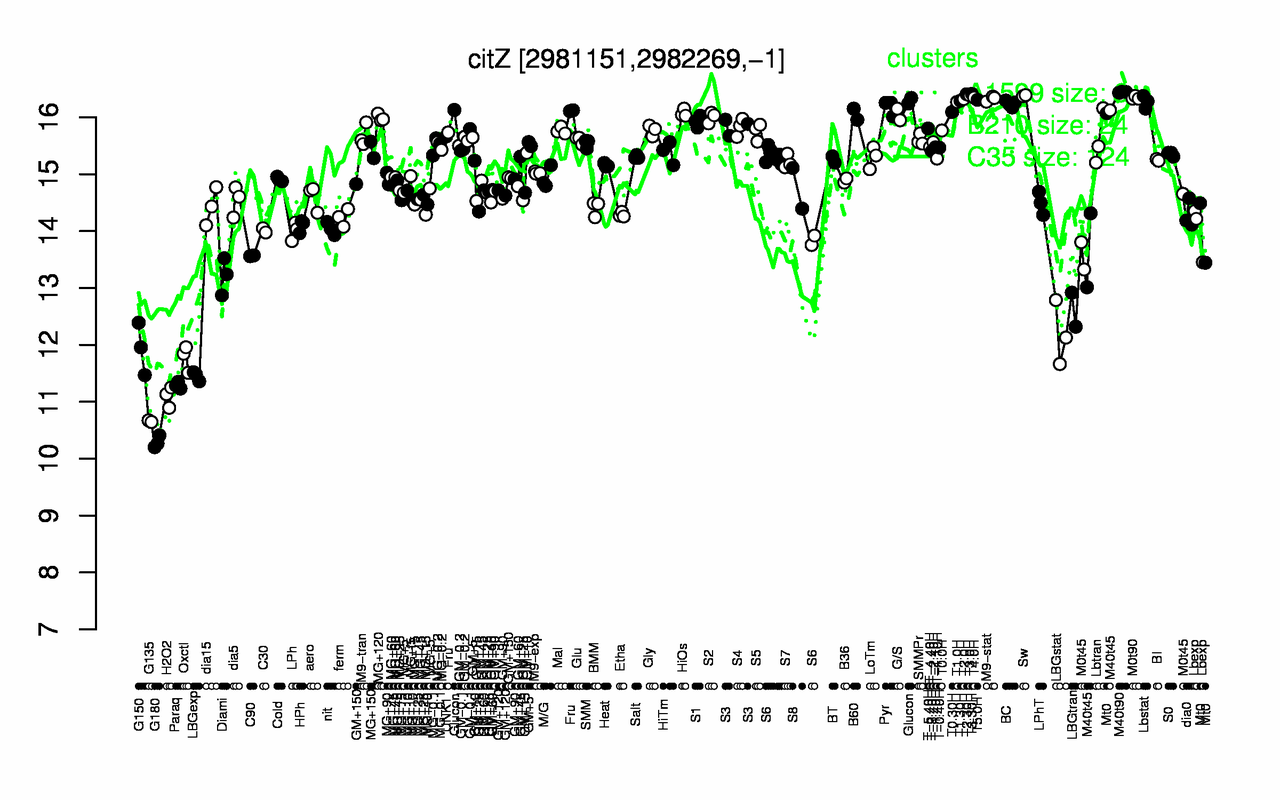
| M40t90 | T3.30H | T2.30H | T3.0H | Sw | T4.0H | M0t90 | M9-stat | T2.0H | T5.0H |
| 16.4 | 16.4 | 16.4 | 16.4 | 16.4 | 16.3 | 16.3 | 16.3 | 16.3 | 16.3 |
| G180 | G135 | H2O2 | Paraq | LBGexp | Oxctl | G150 | LBGstat | LBGtran | Diami |
| 10.3 | 10.7 | 11.1 | 11.3 | 11.5 | 11.8 | 11.9 | 12.2 | 12.6 | 13.2 |