| Start Page |
|
 |
| Start Page |
|
|
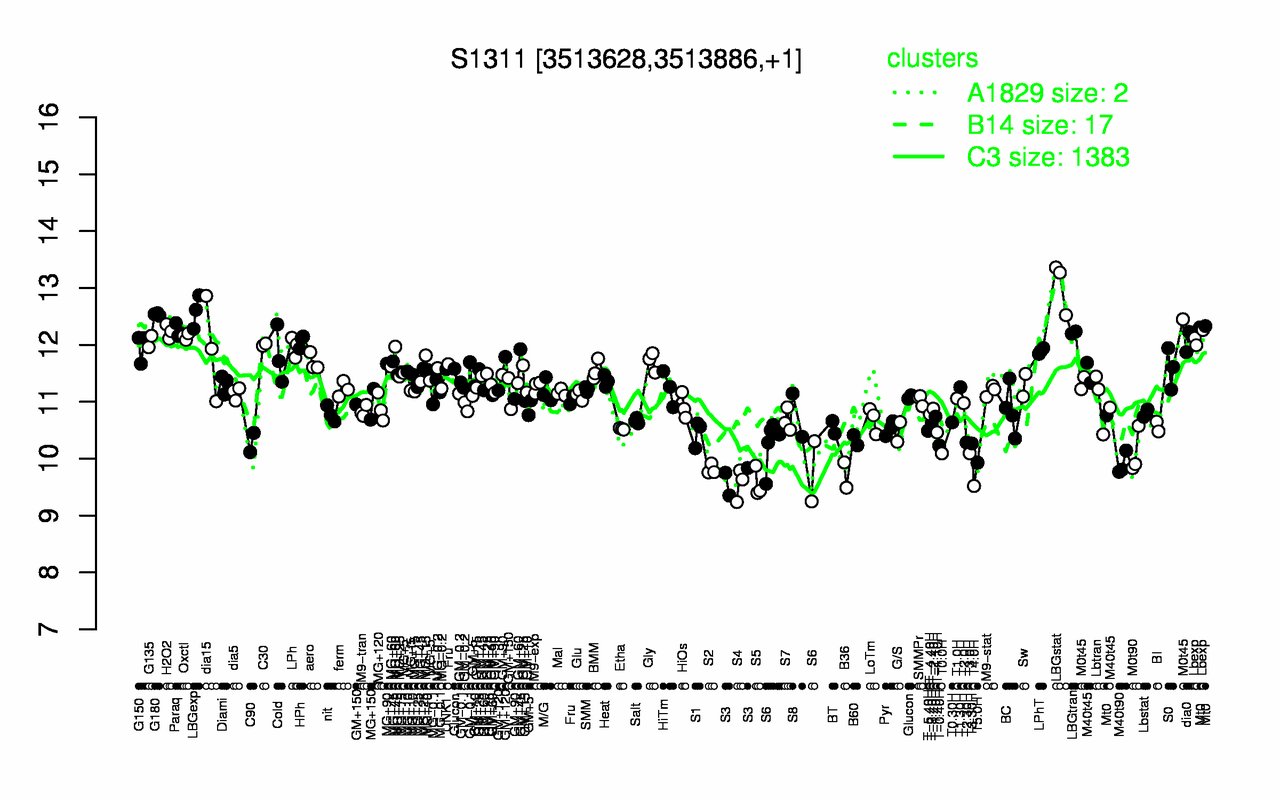
| LBGstat | LBGexp | G180 | Paraq | H2O2 | LBGtran | Oxctl | Lbexp | dia0 | HPh |
| 13.1 | 12.6 | 12.5 | 12.2 | 12.2 | 12.2 | 12.1 | 12.1 | 12.1 | 12.1 |
| T4.0H | S4 | S5 | S3 | B36 | S2 | M40t90 | T5.0H | T0.0H | T3.0H |
| 9.52 | 9.55 | 9.57 | 9.65 | 9.71 | 9.81 | 9.91 | 9.93 | 10.1 | 10.1 |