| Start Page |
|
 |
| Start Page |
|
|
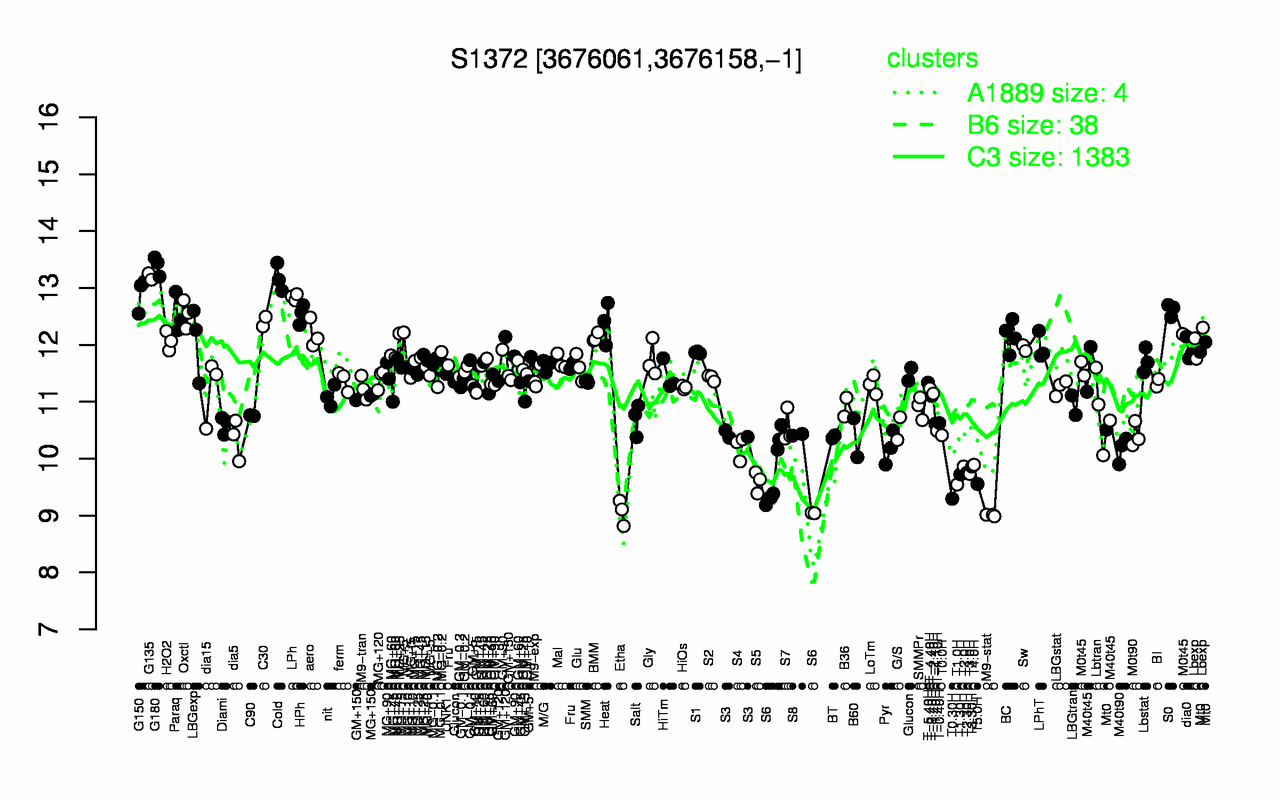
| G180 | G135 | Cold | G150 | LPh | S0 | Oxctl | Paraq | HPh | C30 |
| 13.4 | 13.2 | 13.2 | 12.9 | 12.8 | 12.6 | 12.5 | 12.5 | 12.5 | 12.4 |
| M9-stat | Etha | T0.30H | T1.0H | T5.0H | S5 | S6 | T1.30H | T3.0H | T2.30H |
| 9 | 9.06 | 9.3 | 9.55 | 9.56 | 9.59 | 9.59 | 9.72 | 9.73 | 9.75 |